










Banking crises are commonly associated with bank runs and banking panics, yet our empirical understanding of bank runs is constrained by a lack of bank-level data. In a new paper, we use large language models (LLMs) to extract information on bank runs from millions of digitized historical newspaper pages, creating the most comprehensive database of bank runs in U.S. history. Every bank run episode that we identify is documented on a companion website where users can browse and examine individual episodes, and read the original newspaper articles. In this post, we describe how we built this dataset and discuss what its basic features reveal.
Author Brief
We used large language models to create the most comprehensive database of bank runs in U.S. history.
— Stephan Luck, coauthor
How Newspapers Can Help Us to Understand Bank Runs
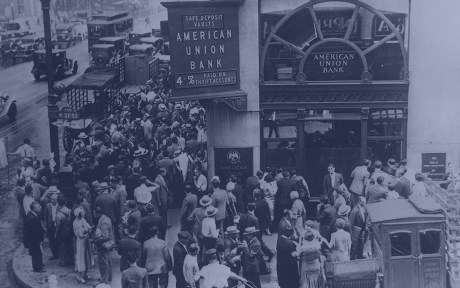
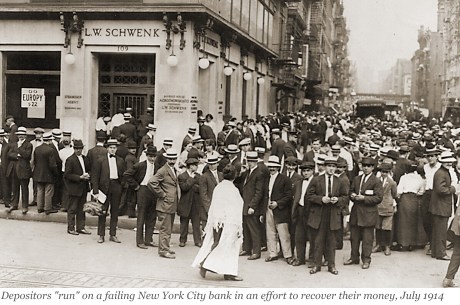
Until the end of the acute phase of the Great Depression in 1933, bank runs were a recurring feature of American economic life. However, they left few traces in official records. Historical regulatory filings, such as those from the Office of the Comptroller of the Currency, document when a bank closed its doors. But such records do not indicate whether a run occurred before failure. Similarly, there are no systematic records that document episodes when a bank was subject to a run but nevertheless continued operating and thus never appeared in any regulatory list of bank closures.
In our new paper, we attempt to overcome this challenge by extracting information on bank distress events from historical newspapers. We exploit that the Library of Congress’s Chronicling America project has digitized tens of millions of historical newspaper articles. This archive is a treasure trove for economic historians and contains an enormous amount of information. Although its sheer scale presents a challenge, advances in large language models and computing power have made such historical records accessible to researchers. In the following, we describe how we make this vast database speak to us about bank runs.
Letting the Newspapers Speak
For our analysis, we start with a body of more than 374 million newspaper articles (Dell et al., 2023). To arrive at a structured dataset that enables us to analyze the information content of the newspaper articles systematically, we build a data extraction pipeline. We first search the digitized newspaper archives for articles mentioning specific banks in conjunction with a variety of keywords suggesting financial distress like “bank run,” “deposit withdrawals,” “suspended,” and “closed its doors.” This initial keyword search reduces the set of 374 million articles to a smaller set of about a million “candidate articles.”
Then we feed each candidate article to various LLMs and prompt these models to extract structured information: Which bank is described? What happened? Was there a depositor run, a suspension of payments, a closure, a reopening? When did each event occur? We also ask the models to classify how the bank responded to the run, if one occurred. Did the bank receive help from a clearinghouse? Did it make a public display of solvency? Did shareholders inject new capital? What caused the run in the first place? Was it driven by macroeconomic news, bank-specific adverse information, or rumors?
Crucially, the LLMs allow us to do more than simple keyword matching. Nineteenth-century newspaper prose is rich and varied; reporters described the same phenomena in dozens of different ways. An article might describe depositors “clamoring for their money” without ever using the word “run.” False positives can occur when articles describe how “a ship runs into a riverbank” or the owner of a bank “runs for office.” The language model can understand these descriptions in context, something that rigid keyword-based approaches would miss. The LLM also helps us understand whether the same event is described in multiple articles.
To ensure high data quality, we use multiple LLMs in order to reduce chances of incorrect results and pay special attention to cases in which different models provide different answer to our questions posed above. We further validate our LLM classifications against hand-coded samples and find high agreement, giving us confidence that the automated approach produces reliable data at scale.
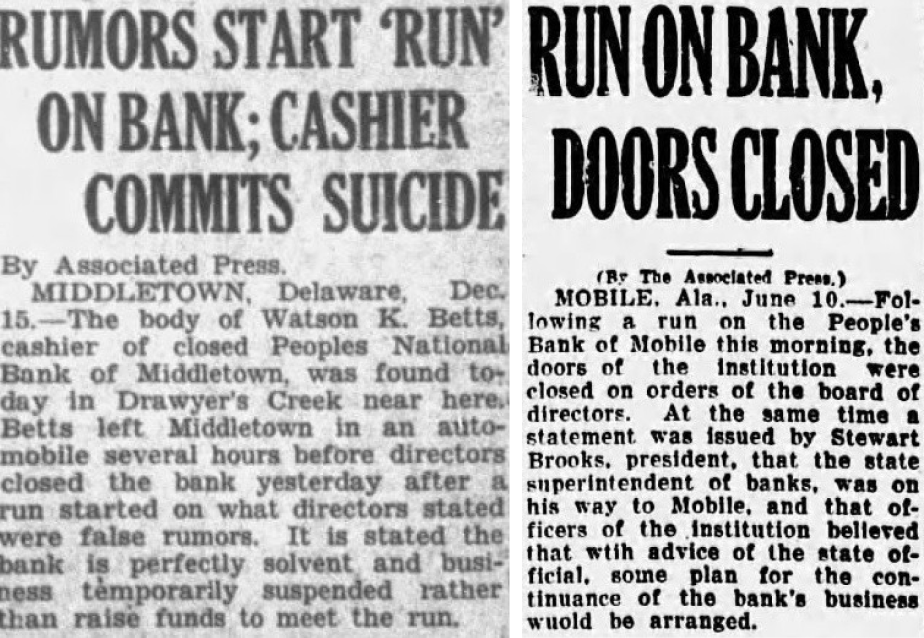
The complete database is publicly available at www.finhist.com/bank-runs, where every episode is browsable by state, city, year, or bank type. Each episode links to the original newspaper articles. Below, see two examples of how newspapers reported about bank runs. We invite researchers and the public to explore the data—to read the newspaper accounts firsthand, to trace individual episodes, and to see what history, with a little help from AI, can tell us about the dynamics of financial instability.
Source: Historical Financial Data.
Notes: Left panel: Coverage of Peoples National Bank, Middletown, Delaware, Dec. 15, 1928. Right panel: Coverage of Peoples Bank, Mobile, Alabama, June 10, 1927.
Bank Runs versus Bank Failures
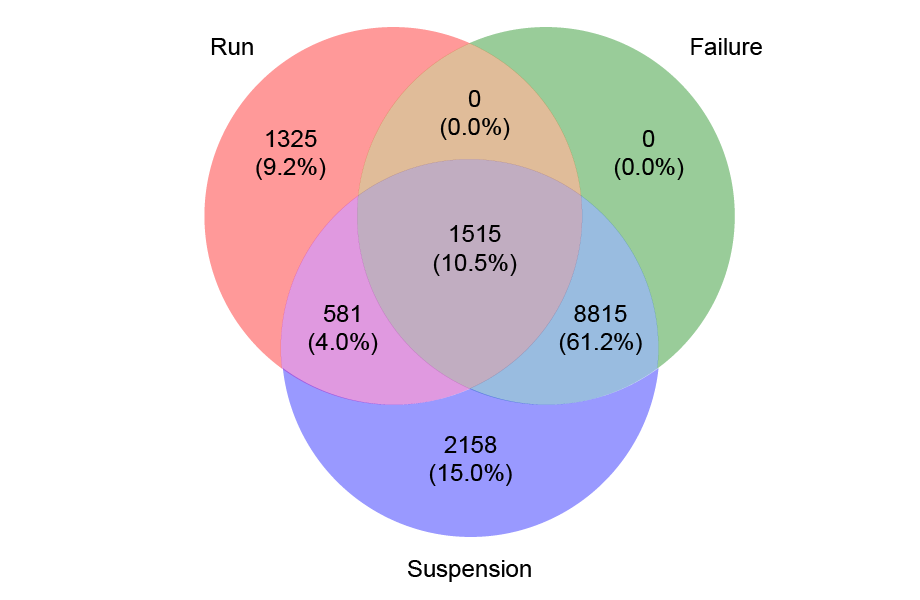
We consider three types of distress events: bank runs, suspensions, and failures. Different combinations of events can characterize different types of distress episodes. For instance, there can be bank runs that involve bank failure and permanent bank closure. There can also be distress episodes with a bank run but no bank failure, distinguishing between those resolved with and without suspension. Finally, there can be episodes in which a bank fails but there is no record of a run. Note that by construction a bank must suspend before or at failure. Thus, any failure will also be a suspension.
The figure below shows a Venn diagram with counts of the three types of distress episodes. Each observation represents an episode of bank distress for a particular bank, with the same bank possibly being subject to distress at different points in time over the sample period. During the 1863-1934 period, our dataset contains more than 3,000 bank run episodes. A first major insight from our data is that the majority of bank runs do not involve failure. We find 1,906 runs without failure and 1,515 runs with failure. We also find 13,069 episodes involving a suspension, and 10,330 episodes involving a failure. Thus, the majority of distress episodes recorded in newspapers involve a bank failure.
The Intersection of Bank Runs, Bank Suspensions, and Bank Failures
Bank Runs from 1863-1935
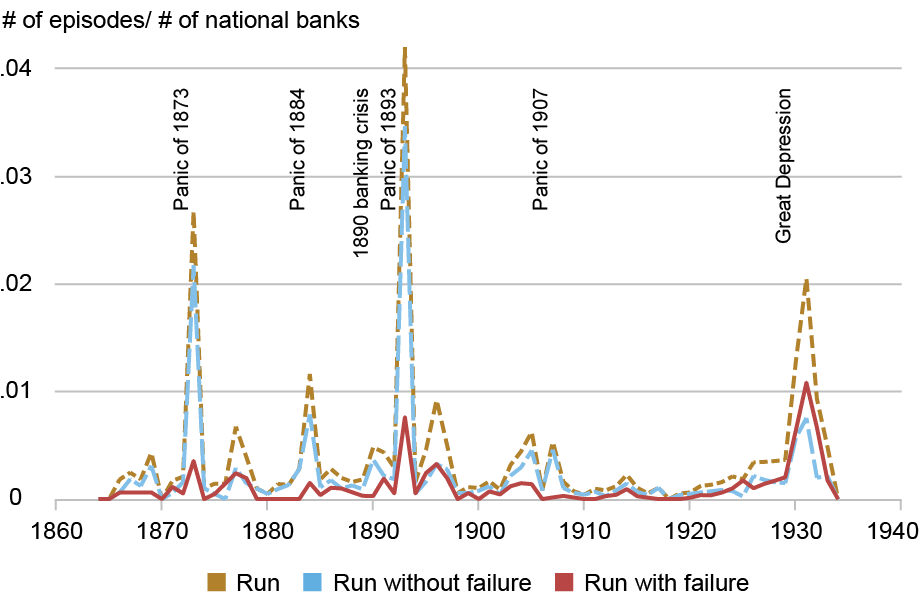
The chart below shows the rate of runs in the time series by plotting the number of runs as a fraction of the total number of banks in each year. We focus on national banks so that we can calculate rates relative to the total number of banks. The rate of runs spikes during the major crises years: 1873, 1884, 1893, 1907 (to a lesser extent), and the Great Depression. This incidence of runs confirms prominent narratives of crises in the pre-FDIC era (e.g., Calomiris and Gorton, 1991; Wicker, 1996, 2006).
Bank Runs With and Without Failure from 1863 through 1934
Note: Based on a sample of national banks.
The chart also distinguishes between bank runs with and without failure. Runs without failure are especially pronounced during major banking crises, especially during the panics of the national banking era. For example, the Panic of 1893 featured a particularly large number of runs without failure (but with temporary suspensions). Runs with failure spiked during the Panic of 1893 and the Great Depression.
The Geography of Bank Runs
The animated map below shows how bank runs ripple across the country over time. Each episode appears as a glowing dot at its geographic location on its recorded date, fading over the course of the following year.
The dynamics of bank runs from 1863 through 1934 illustrate several patterns immediately. First, the geographic center of gravity of bank distress shifts over the decades. Early episodes are concentrated along the Eastern Seaboard: New York, Philadelphia, and the major commercial cities. As the country expands westward, so does banking distress. By the 1890s, runs are appearing in the Great Plains, the Mountain West, and the Pacific Coast, reflecting the expansion of the banking system into new agricultural and mining frontiers.
Second, the systemic crises show up as nationwide waves. During the Panic of 1873, for instance, dots first cluster in New York City, the epicenter of the financial system, and then radiate outward to Chicago, St. Louis, New Orleans, and smaller cities across the interior. The 1893 crisis, in contrast to the other panics of the National Banking Era, originated in the interior and saw more runs in the West and South, consistent with distress in railroads, silver mines, and agriculture in that panic. In 1907, the crisis again starts in New York but spreads rapidly through the national correspondent banking network.
Third, the map reveals the regional character of many episodes that do not rise to the level of a national panic. The U.S. banking system of the time contained thousands of small, under-diversified banks. Local economic downturns, crop failures, or exposure to commodity price declines could generate bank runs and failures without necessarily showing up in the national narrative. The 1920s, often remembered as a decade of prosperity, are marked on the map by a steady stream of bank failures in the agricultural Midwest and South, foreshadowing the surge in bank failures during the Great Depression.
What Comes Next
This new database on bank runs opens the door to answering a range of questions that were previously difficult to study. In our companion post, we show how we use the data to investigate when and why runs have historically led to bank failure, and discuss how these insights affect policy discussions.

Sergio Correia is a senior economist at the Federal Reserve Bank of Richmond.

Stephan Luck is a financial research advisor in the Federal Reserve Bank of New York’s Research and Statistics Group.
Emil Verner is the Lemelson Professor of Management and Financial Economics and a professor of finance at MIT Sloan School of Management.
How to cite this post:
Sergio Correia, Stephan Luck, and Emil Verner, “Using AI to Let History Speak About Bank Runs,” Federal Reserve Bank of New York Liberty Street Economics, July 7, 2026, https://doi.org/10.59576/lse.20260707a
BibTeX: View |

Disclaimer
The views expressed in this post are those of the author(s) and do not necessarily reflect the position of the Federal Reserve Bank of New York or the Federal Reserve System. Any errors or omissions are the responsibility of the author(s).
 RSS Feed
 Follow Liberty Street Economics
