


In imperial China, 3 percent was the maximum legal monthly loan rate; charging more was punishable by 40 to 100 blows with the “light cane.” (Rockoff 2003) Centuries later, many U.S. states are imposing the same cap (without corporal penalties) on alternative credit providers, such as payday, installment, and auto-title lenders, with the goal of lowering credit costs and delinquency for the high-risk borrowers that rely on these funding sources. A concern, however, is that lenders will simply refuse to lend to these borrowers at lower interest rates. Our recent Staff Report studies how interest rate caps have played out in several states that recently adopted them. Using household-level data from a major credit bureau, we find that loan balances for the riskiest borrowers declined substantially relative to counterparts in states without caps. Despite taking on less debt, these borrowers did not experience an improvement in delinquencies.
The Resurgence of Usury Limits
Usury limits have waned over the centuries in the U.S, but their recent resurgence on the consumer side was triggered by payday lenders’ entry into the small dollar loan market in the mid-1990s (Rockoff 2003). In 2007, rates on loans to military staff were capped at 36 percent—marking the first-ever national usury limit in the U.S. A bill currently before Congress, the Predatory Loan Elimination Act, would extend the 36 percent cap across the entire U.S.
Saunders (2021) traces the 36 percent standard back to credit reform in the early 20th century. Concerned that prevailing usury limits were too low, the Russell Sage Foundation promulgated a Uniform Small Loan Law recommending a higher cap of 3.5 percent per month. Thirty-four states raised caps to between 36 and 42 percent over the next few decades (Anderson et al. 2015).
Cheaper Credit…or Less Credit?
Opponents of rate caps predict that they will lower the supply of credit for riskier borrowers rather than drive down the cost of credit. The textbook credit model below illustrates this effect. In this model, lenders separately provide credit for high-risk borrowers (sH) and low-risk borrowers (sL). At market equilibrium, lenders charge high-risk borrowers i*, which is higher than what they would charge low-risk borrowers; lenders charge high-risk borrowers a higher interest rate to compensate for higher expected loan losses. However, a usury cap requires lenders to charge no higher than icap for interest, which is lower than the equilibrium rate i*. As a result, lenders contract the quantity of loans supplied, as shown. In fact, if profits from loans to high-risk borrowers don’t cover the fixed cost of providing them, lenders may entirely refuse to make any loans to high-risk borrowers, which is referred to as credit rationing. This is particularly likely as less creditworthy borrowers are also typically more likely to take out relatively small loans.
Note that icap is higher than the equilibrium interest rate for low-risk borrowers, and under standard model assumptions, lending to lower-risk borrowers does not change. However, under certain conditions, the rate cap could also have implications for low-risk borrowers, a situation we examine in the next post in this series.
Rate Caps May Contract Credit to Riskier Borrowers
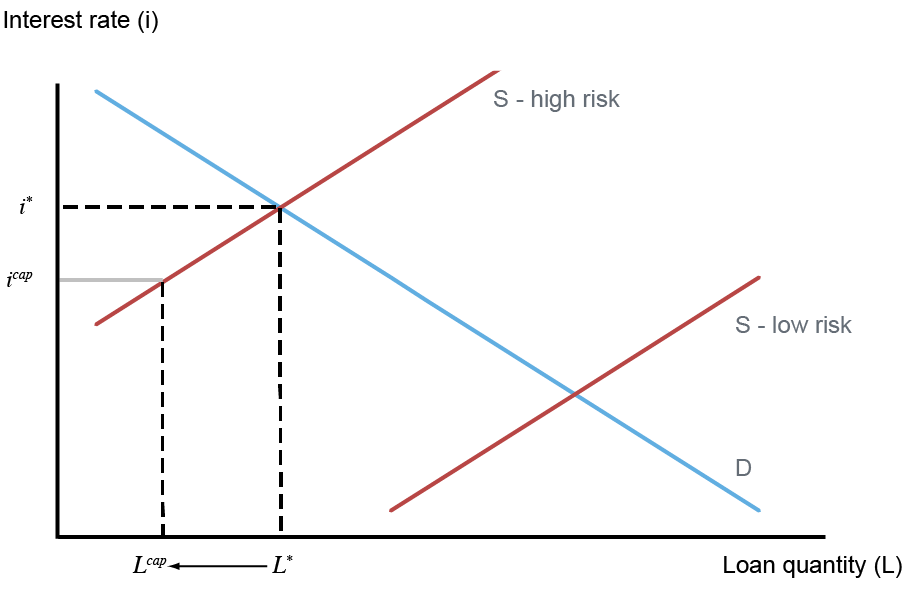
Notes: This chart shows a simple model of consumer lending and illustrates how a usury cap would affect the market. There are two types of borrowers—high-risk and low-risk—and supply of credit is separately determined for high- (sH) and low-risk borrowers (sL). At equilibrium, high-risk borrowers are able to borrow L* dollars of loans, at an interest rate of i*. Under the usury cap, lenders can only charge icap, and as a result reduce the quantity of loans supplied to Lcap.
Our Study
We examined how credit changed in three states that enacted 36 percent rate caps sometime between 2016 and 2022 (Illinois, South Dakota, and North Dakota). Only alternative lenders’ loan rates are capped; banks and credit unions are exempt. Our data are from the New York Fed Consumer Credit Panel/Equifax (CCP), which tracks quarterly debt and delinquency for an anonymized, random subset of households covered by the Equifax credit bureau. Comprising 5 percent of Equifax-monitored households, the sample includes over 35 million borrowers.
Since rate caps are more likely to bind for riskier borrowers, we sorted households into ten equal-sized groups (deciles) based on their credit scores (Equifax Risk Score 3.0), with the lowest-scoring borrowers in the first decile. The average loan delinquency rate for this group was over six times higher than the average across the other deciles.
To get a sense of the data, the chart below shows average loan balances for borrowers in the states with usury limits (excluding mortgages and student loans) for each risk decile. Predictably, households with the lowest and highest scores owe less. More relevant is that balances declined by about 8 percent for the first (riskiest) decile after rates were capped; balances for safer borrowers were little changed overall.
Loan Balances for the Riskiest Borrowers Declined After Rate Caps
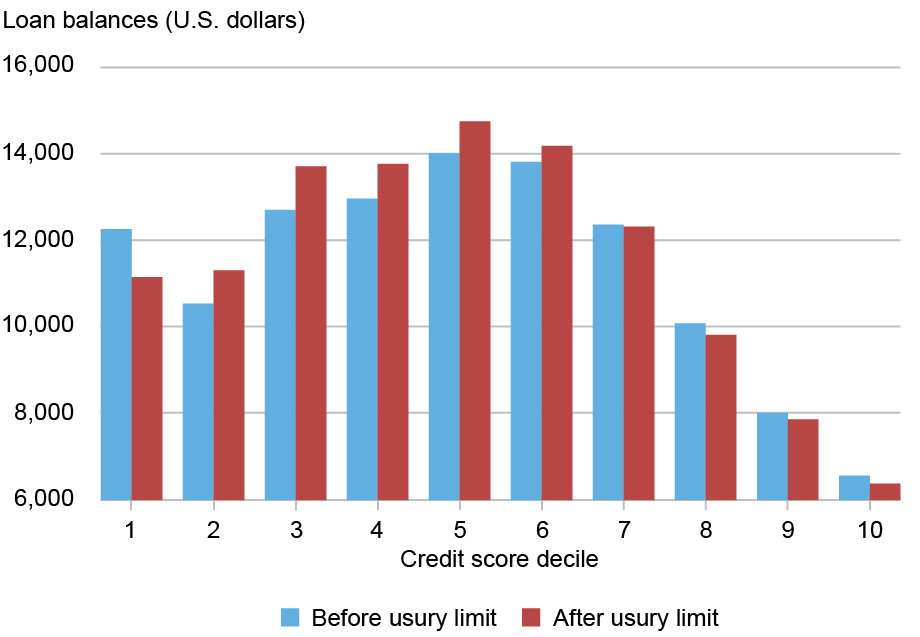
Notes: This chart shows how average loan balances for households in Illinois, North Dakota, and South Dakota changed after loan rates were capped in those states. Households are stratified by credit score decile, with decile 1 containing those with the lowest scores. Mortgage and student loans are excluded.
Lower debt balances might be salutary if they reflect that riskier borrowers are avoiding “debt traps.” Yet rate caps did not lead to fewer delinquencies for those borrowers, as the chart below shows. Their share of delinquent accounts (90+ days overdue) was essentially unchanged, while delinquency for somewhat lower-risk households tended to fall.
Loan Delinquency Among the Riskiest Borrowers Did Not Decline After Usury Limits
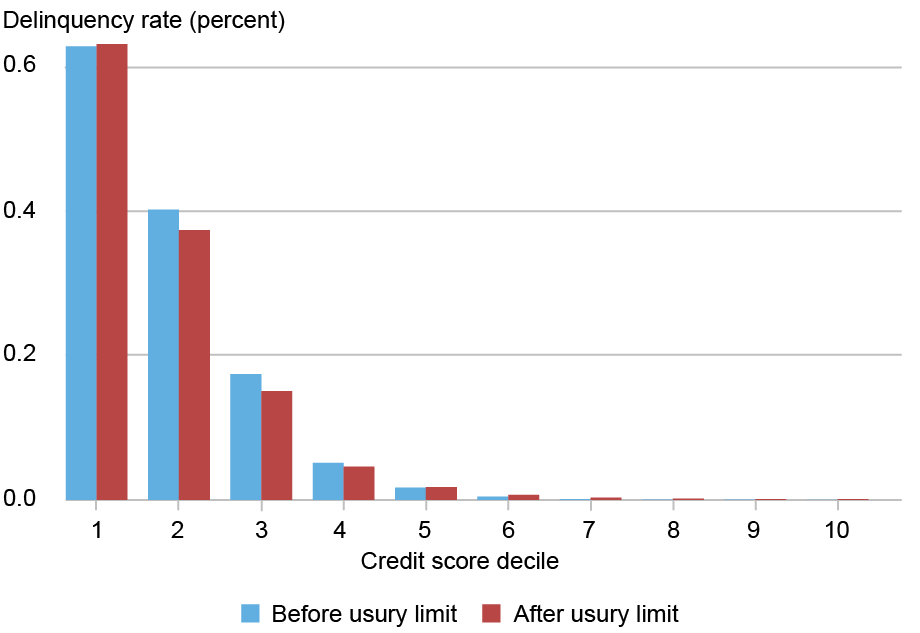
Notes: This chart shows how delinquency rates for households in Illinois, North Dakota, and South Dakota changed after loan rates were capped in those states. Households are stratified by credit score decile, with decile 1 containing those with the lowest scores. Delinquency is measured by the share of accounts that are 90+ days overdue. Delinquencies on all types of debt are included in the chart.
Cross-State Comparison
The charts above only show changes in credit for borrowers in the states that capped rates. In our main analysis, we compare borrowers in those states to counterparts in a set of control states that did not cap rates over the study period. Using regression analysis, we estimate how credit for high-risk borrowers in the treated states changed relative to counterparts after rate caps took effect, where high-risk borrowers are defined as those who were in the lowest decile of risk scores before the usury limit. In particular, we estimate an event-study regression to examine how credit market outcomes changed for high-risk borrowers in states with usury limits, relative to control with no usury limit. Importantly, these regressions allow us to control for changes over time happening in each state that are unrelated to the usury limit, and for differences between borrowers unrelated to the usury limit.
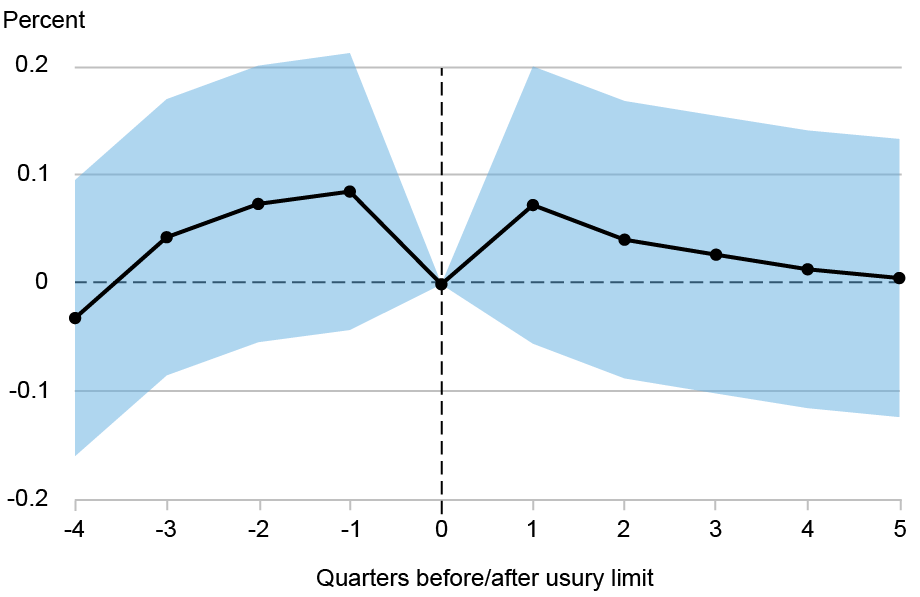
The estimates for loan balances are plotted below, along with confidence intervals. Relative to control state levels, the average loan balances of the riskiest borrowers in rate-cap states were not significantly different before those caps took effect, which indicates that the control groups used in this study offer a reasonable point of comparison. However, they declined significantly afterward. The effect is substantial. Specifically, as of five quarters after rates are capped, debt balances of the riskiest borrowers in those states fall by around $2,000, relative to the balances of the riskiest borrowers in control-states.
Balances for the Riskiest Borrowers Decline After Rate Caps Relative to Control States
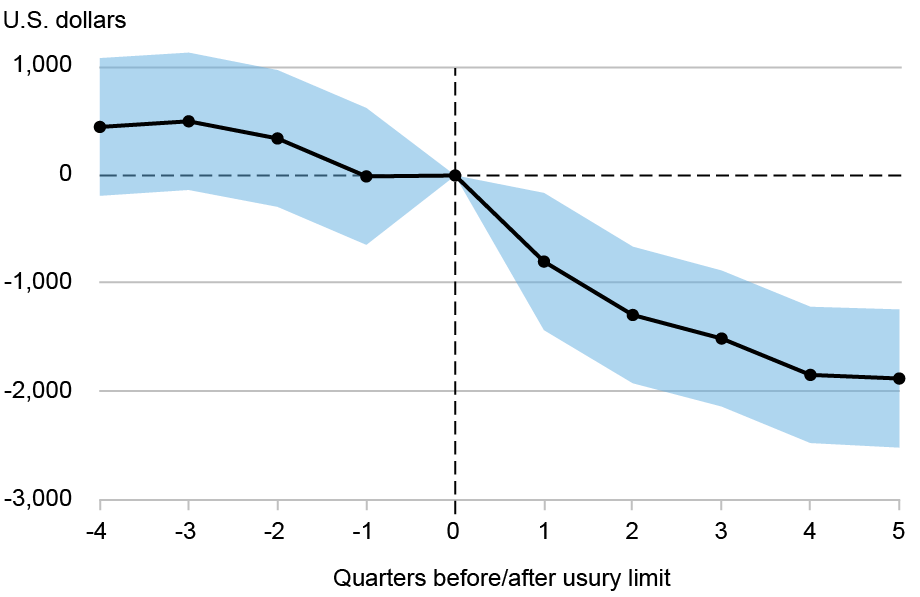
Note: This chart shows how the debt balances of high-risk borrowers in Illinois, North Dakota, and South Dakota changed after the implementation of usury limits in those states, relative to the debt balances of their counterparts in control states.
The next chart shows how relative delinquencies evolved. These estimates are less precise (as reflected in the wide confidence bands), but they certainly do not point to a decline in delinquencies. Overall, it seems that there was no change in delinquencies for the riskiest borrowers in states with usury limits relative to those in control states after the usury limits were passed.
Delinquency Rates of Riskiest Borrowers Hold Steady Relative to Control States
Sources: New York Fed Consumer Credit Panel/Equifax; authors’ calculations.
Note: This chart shows how the probability of having a delinquent loan changed for high-risk borrowers in Illinois, North Dakota, and South Dakota after the implementation of usury limits in those states, relative to delinquency rates for their counterparts in control states.
Summing Up
Usury limits, an ancient type of financial regulation, are resurgent in the U.S. Advocates expect rate caps to lower borrowing costs for high-risk borrowers while opponents predict that the result will be less credit for these borrowers. Our findings square better with the latter view, calling into question the benefits of these laws for high-risk borrowers. In our next post, we examine whether lenders reallocate credit to somewhat lower-risk borrowers in response to rate caps.

Rajashri Chakrabarti is an economic research advisor in the Federal Reserve Bank of New York’s Research and Statistics Group.

Gabriel Leonard is a research analyst in the Federal Reserve Bank of New York’s Research and Statistics Group.

At the time this post was written, Donald P, Morgan was a financial research advisor in the Federal Reserve Bank of New York’s Research and Statistics Group. He is now retired.

Thu Pham is a research analyst in the Federal Reserve Bank of New York’s Research and Statistics Group.

Lee Seltzer is a financial research economist in the Federal Reserve Bank of New York’s Research and Statistics Group.
How to cite this post:
Rajashri Chakrabarti, Gabriel Leonard, Donald P. Morgan, Thu Pham, and Lee Seltzer, “The Unintended Effects of Interest Rate Caps: Credit Rationing for Risky Borrowers,” Federal Reserve Bank of New York Liberty Street Economics, June 3, 2026, https://doi.org/10.59576/lse.20260603a
BibTeX: View |

Disclaimer
The views expressed in this post are those of the author(s) and do not necessarily reflect the position of the Federal Reserve Bank of New York or the Federal Reserve System. Any errors or omissions are the responsibility of the author(s).
 RSS Feed
 Follow Liberty Street Economics