In March 2020, as the COVID-19 pandemic disrupted a range of financial markets, the ability of dealers to maintain liquid conditions in these markets was questioned. Reflecting these concerns, authorities took numerous steps, including providing regulatory relief to dealers. In this post, we examine liquidity provision by dealers in several financial markets during the pandemic: how much was provided, possible causes of any shortfalls, and the effects of the Federal Reserve’s actions.
Dealer Inventory Positions during the Pandemic
Dealers support market liquidity by intermediating customer trades—for example, by taking customer sell orders into inventory when buyers are absent. Hence, changes in the size of their inventory positions can indicate whether dealers are performing intermediation activities.
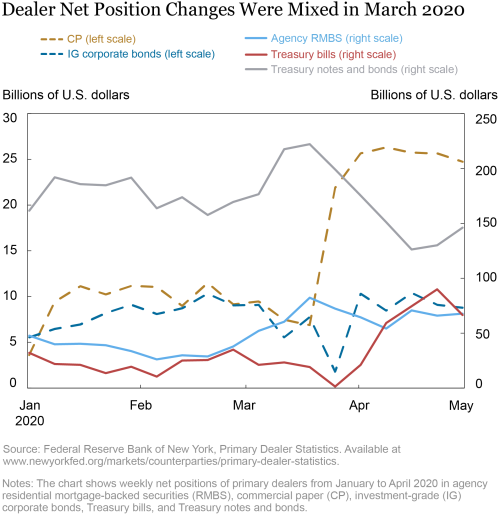
The chart below shows that primary dealer net positions in commercial paper (CP) and investment-grade (IG) corporate bonds (dashed lines, marked on the left vertical axis) fall starting the week of February 26 and bottom out in the week of March 18 (for CP) and March 25 (for IG bonds) before recovering in April. By comparison, dealer net positions in U.S. Treasury bills, Treasury notes and bonds, and agency residential mortgage-backed securities (RMBS) (solid lines, marked on the right vertical axis) are generally higher or similar in March as compared to their prior levels–although net positions in bills fell sharply in the week of March 25. Overall, dealers cut inventory in some markets but increased or maintained it in others in March.
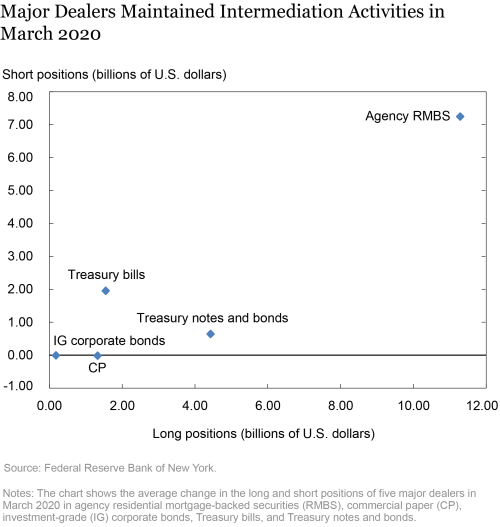
Net positions that result from substantial long and short positions are more likely to indicate intermediation activities than one-sided positions—say, moderate long but minimal short positions. Using the microdata underlying the aggregate dealer statistics, we plot the changes in the long and short positions in March 2020 averaged across five major dealers with significant market share in all securities (see chart below). Major dealers increased both their long and short positions in markets where dealers in the aggregate increased or maintained net positions in March (bills, notes and bonds, and agency RMBS). In markets where aggregate dealer net positions decreased (CP and IG bonds), major dealers did not expand inventory but did not reduce it either. Thus, it appears that major dealers generally maintained intermediation activity at the height of the pandemic.
Market Liquidity and Dealer Intermediation in March 2020
In CP and corporate bond markets, limited dealer intermediation and heightened market illiquidity went hand in hand, and improved only after the Fed’s actions. For example, the Commercial Paper Funding Facility (CPFF) was announced on March 17, and dealer net positions recovered the week of March 25. Similarly, two corporate bond facilities were announced on March 23 to support IG bonds. Liquidity in the corporate bond market improved on the announcement, and dealer net positions recovered in the week of April 1.
In contrast, even as dealers maintained intermediation, market dysfunction continued apace in U.S. Treasury and agency MBS markets in March 2020. What accounts for this disjunction? One possibility is that the amount of liquidity provided by dealers was insufficient to meet the volume of customer selling, as shown for the agency MBS markets. Ultimately, the Fed’s massive purchases of Treasury and agency MBS securities helped to accommodate the selling pressure.
Why Did Dealers Provide Insufficient Liquidity?
During crises, customers may sell in such large amounts that dealers are reluctant to fully absorb the orders into their inventory, thereby impeding liquidity. Their reluctance may arise because internal risk management practices limit their positions in times of enhanced market volatility or because the costs of holding more inventory are prohibitive (for example, due to regulatory constraints). For example, following the selloff in fixed income markets during the taper tantrum of 2013, dealers reduced both net positions and risk-taking.
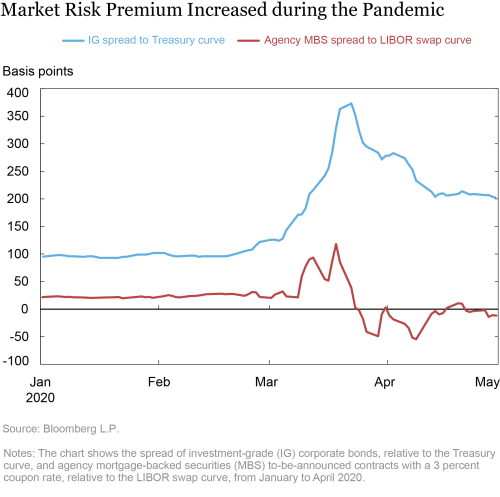
Dealer risk management. Increased costs of taking on risk may hinder dealers in taking on bigger positions. Consider the market risk premium, which indicates the compensation required by investors to bear risk, including inventory risk. The chart below shows that the agency MBS spread to LIBOR spiked on March 9, when market-wide circuit breakers were triggered for the first time since 1997, and remained high through the third week of March. The IG bond spread to Treasuries increased earlier but also spiked on March 9 before peaking on March 23. These results suggest that dealers’ cost of bearing inventory risk increased in March.
When dealers increase their net positions, and the cost of doing so also rises, they are exposed to greater risk of being stuck with excess inventory. This inventory risk increases when market volatility spikes, as occurred during the pandemic. A measure of risk exposure is value at risk (VaR) which is the worst expected loss over a given time horizon at a given confidence level. A variant is stressed VaR in which the expected loss is calculated during a period of financial stress. The chart below shows that the average VaR and stressed VaR of the banks that the five major dealers are affiliated with increased sharply in 2020:Q1, indicating greater risk exposure.
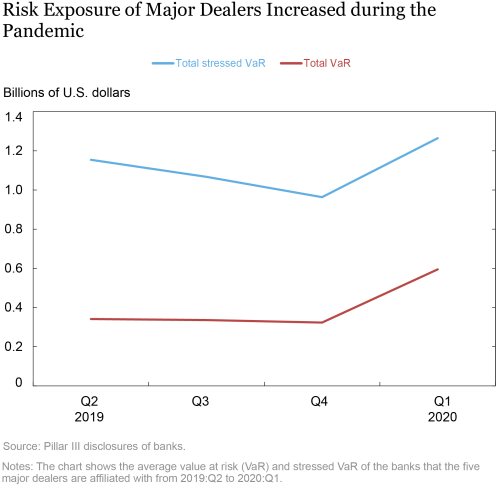
In sum, increased dealer positions during the pandemic, combined with an increased cost of taking on positions, boosted dealers’ risk exposure, thereby limiting their capacity to bear risk and make markets.
Regulation and dealer balance sheet capacity. Regulation may also constrain dealer intermediation activity by requiring dealers to hold more capital for regulatory purposes. For example, the supplementary leverage ratio (SLR) requires the largest banks to hold a minimum ratio of 3 percent of tier 1 capital to total on- and off-balance sheet exposures.
In the chart below, we show changes in the long and short positions in March 2020 of unaffected dealers (that is, those affiliated with banks not subject to the SLR). If the SLR was a binding constraint on dealer intermediation, then we might expect these positions to increase relative to the major dealers (all of whose affiliated banks were subject to the SLR). In fact, the chart indicates that unaffected dealers mostly did not expand their long and short positions and, in many cases, reduced them. In contrast, our earlier chart showed that long and short positions of major dealers did not decrease and in some cases increased.
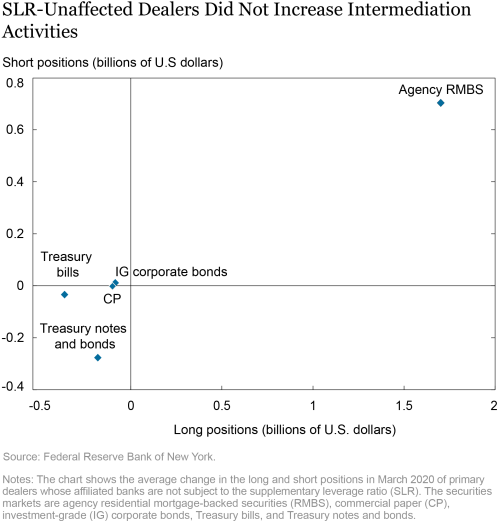
On April 1, 2020, the Fed temporarily allowed banks to exclude U.S. Treasury securities and deposits at Federal Reserve Banks when calculating their total leverage exposure, in order to provide dealers “increased flexibility to continue to act as financial intermediaries.” On March 19, 2021, the Fed announced that the temporary change to the SLR will expire as scheduled on March 31.
Enhancing Market Making Capacity
How might market making capacity be improved? One suggestion is to implement central clearing which reduces the amount of dealer balance sheet required due to improved netting of trades. Faster settlement times also help dealers economize on balance sheet space. In the agency MBS market, the Fed innovated in how it purchased securities to allow dealers to reduce their inventory rapidly, much sooner than market convention would otherwise allow, thereby reducing the short-term selling pressure on the market. Another suggestion is to reduce the costs of regulation. There have also been discussions about the composition of the investor base and increasing the number of primary dealers. Whatever the approach, the sharp decline in market liquidity during the pandemic lends urgency to initiatives that might enhance intermediation capacities of the dealer community.
Jiakai Chen is an assistant professor at the Shidler College of Business, University of Hawaii.
 Haoyang Liu is an economist in the Federal Reserve Bank of New York’s Research and Statistics Group.
 David Rubio is a senior research analyst in the Bank’s Research and Statistics Group.
 Asani Sarkar is an assistant vice president in the Bank’s Research and Statistics Group.
Zhaogang Song is an associate professor at the Johns Hopkins Carey Business School.
How to cite this post:
Jiakai Chen, Haoyang Liu, David Rubio, Asani Sarkar, and Zhaogang Song, “Did Dealers Fail to Make Markets during the Pandemic?,” Federal Reserve Bank of New York Liberty Street Economics, March 24, 2021, https://libertystreeteconomics.newyorkfed.org/2021/03/did-dealers-fail-to-make-markets-during-the-pandemic.html.
Related Reading
Dealer Balance Sheet Capacity and Market Liquidity during the 2013 Selloff in Fixed-Income Markets (October 16, 2013)
The COVID-19 Pandemic and the Fed’s Response (April 15, 2020)
Treasury Market Liquidity during the COVID-19 Crisis (April 17, 2020)
The Commercial Paper Funding Facility (May 15, 2020)
MBS Market Dysfunctions in the Time of COVID-19 (July 17, 2020)
The Impact of the Corporate Credit Facilities (October 1, 2020)
Disclaimer
The views expressed in this post are those of the authors and do not necessarily reflect the position of the Federal Reserve Bank of New York or the Federal Reserve System. Any errors or omissions are the responsibility of the authors.


 RSS Feed
 Follow Liberty Street Economics