


14 posts on "Economic Inequality"
November 17, 2023
Flood‑Prone Basement Housing in New York City and the Impact on Low‑ and Moderate‑Income Renters
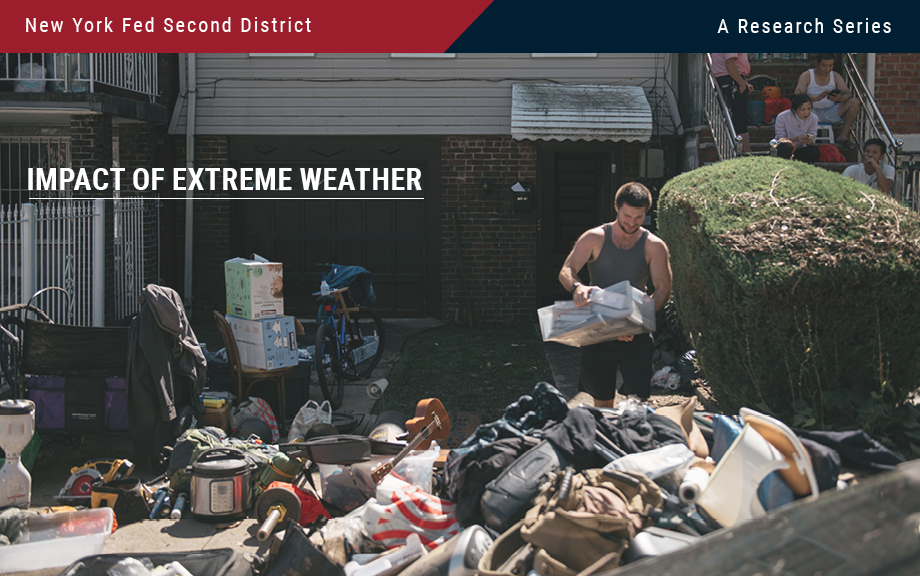
Hurricane Ida, which struck New York in early September 2021, exposed the region’s vulnerability to extreme rainfall and inland flooding. The storm created massive damage to the housing stock, particularly low-lying units. This post measures the storm’s impact on basement housing stock and, following the focus on more-at-risk populations from the two previous entries in this series, analyzes the attendant impact on low-income and immigrant populations. We find that basements in select census tracts are at high risk of flooding, affecting an estimated 10 percent of low-income and immigrant New Yorkers.
July 6, 2023
The EGIs: Analyzing the Economy Through an Equitable Growth Lens

Inflation remains elevated, labor markets are close to the strongest they have been, real consumption is up year-over year, but all of these observations are with respect to averages. Behind these macroeconomic trends can be widely varying experiences across different demographic and socioeconomic groups that make up our society. To provide researchers, practitioners, and the public with timely, regularly updated and comprehensive answers to these questions, we launched the Equitable Growth Indicators (EGIs)—a new tool to help foster the evolving discussion about economic inequality and equitable growth. To illustrate the utility of the EGIs, we provide examples of some striking differences in trends captured in the May release of the EGIs on inflation, real earnings, and real spending. More heterogeneity analysis and data are available at nyfed.org/egi.
May 25, 2023
Do Veterans Face Disparities in Higher Education, Health, and Housing?
Veterans are an understudied group that forms an important part of the fabric of American society and that constitutes a significant segment of the population. In the first post of this two-part series, we will investigate how the outcomes of veteran men–in educational attainment, health, and housing–differ from those of comparable men who did not serve in the military. Looking only at men, for reasons described below, we find that relative to nonveteran men with a high school degree and a similar distribution of demographic and geographic characteristics, veterans are 7 percentage points less likely to have a college degree and are over 50 percent more likely to experience a disability. Veterans are also somewhat likelier to rent a home than to own and, as renters, pay a lower average rent, suggesting they experience lower quality housing or live in worse neighborhoods.
February 27, 2023
Does the CRA Increase Household Access to Credit?
Congress passed the Community Reinvestment Act (CRA) in 1977 to encourage banks to meet the needs of borrowers in the areas in which they operate. In particular, the Act is focused on credit access to low- and moderate-income communities that had historically been subject to discriminatory practices like redlining.
Posted at 7:00 am in Banks, Credit, Equitable Growth, Inequality, Regulation | Permalink | Comments (2)
January 18, 2023
Rural Households Hit Hardest by Inflation in 2021‑22
To conclude our series, we present disparities in inflation rates by U.S. census region and rural status between June 2019 and the present. Notably, rural households were hit by inflation the hardest during the 2021-22 inflationary episode. This is intuitive, as rural households rely on transportation, and especially on motor fuel, to a much greater extent than urban households do. More generally, the recent rise in inflation has affected households in the South more than the national average, and households in the Northeast by less than the national average, though this difference has decreased in the last few months. Once again, these changes in inflation patterns can be explained by transportation inflation driving a large extent of price rises during 2021 and much of 2022, with housing and food inflation lately coming to the fore.
Young, Less Educated Faced Higher Inflation in 2021—But Gaps Now Closed
We continue our series on inflation disparities by looking at disparities in inflation rates by educational attainment and age for the period June 2019 to the present. Remarkably, we find that disparities by age and education are considerably larger than those by income and are similar in size to those by race and ethnicity, both explored in our previous post. Specifically, during the inflationary period of 2021-22, younger people and people without a college degree faced the highest inflation, with steadily widening gaps relative to the overall average between early 2021 and June 2022, followed by a rapid narrowing of the gaps and a reversal of some of them by December 2022. This pattern arises primarily from a greater share of the expenditures of younger people and people without a college degree being devoted to transportation—particularly used cars and motor fuel—which led the 2021 inflationary episode but has since converged to general inflation.
Inflation Disparities by Race and Income Narrow
As inflation has risen to forty-year highs, inflation inequality—disparities in the rates of inflation experienced by different demographic and economic groups– has become an increasingly important concern. In this three-part blog series, we revisit our main finding from June—that inflation inequality has increased across racial and ethnic groups—and provide estimates of differential inflation rates across groups based on income, education, age, and geographic location. We also use an updated methodology for computing inflation disparities by focusing on more disaggregated categories of spending, which corroborates our earlier findings and substantiates our conclusion that inflation inequality is a pronounced feature of the current inflationary episode.
June 30, 2022
How Equitable Has the COVID Labor Market Recovery Been?
One of the two monetary policy goals of the Federal Reserve System— one-half of our dual mandate—is to aim for “maximum employment.” However, labor market outcomes are not monolithic, and different demographic and economic groups experience different labor market outcomes. In this post, we analyze heterogeneity in employment rates by race and ethnicity, focusing on the COVID-19 recession of March-April 2020 and its aftermath. We find that the demographic employment gaps temporarily increased during the onset of the pandemic but narrowed back by spring 2022 to close to where they were in 2019. In the second post of this series, we will focus on heterogeneity in inflation rates, the second part of our dual mandate.
April 21, 2022
Who Are the Federal Student Loan Borrowers and Who Benefits from Forgiveness?
The pandemic forbearance for federal student loans was recently extended for a sixth time—marking a historic thirty-month pause on federal student loan payments. The first post in this series uses survey data to help us understand which borrowers are likely to struggle when the pandemic forbearance ends. The results from this survey and the experience of some federal borrowers who did not receive forbearance during the pandemic suggest that delinquencies could surpass pre-pandemic levels after forbearance ends. These concerns have revived debates over the possibility of blanket forgiveness of federal student loans. Calls for student loan forgiveness entered the mainstream during the 2020 election with most proposals centering around blanket federal student loan forgiveness (typically $10,000 or $50,000) or loan forgiveness with certain income limits for eligibility. Several studies (examples here, here, and here) have attempted to quantify the costs and distribution of benefits of some of these policies. However, each of these studies either relies on data that do not fully capture the population that owes student loan debt or does not separate student loans owned by the federal government from those owned by commercial banks and are thus not eligible for forgiveness with most proposals. In this post, we use representative data from anonymized credit reports that allows us to identify federal loans, calculate the total cost of these proposals, explore important heterogeneity in who owes federal student loans, and examine who would likely benefit from federal student loan forgiveness.
January 6, 2022
The Effect of Monetary and Fiscal Policy on Inequality
How does accounting for households’ heterogeneity—and in particular inequality in income and wealth—change our approach to macroeconomics? What are the effects of monetary and fiscal policy on inequality, and what did we learn in this regard from the COVID-19 pandemic? What are the implications of inequality for the transmission of monetary policy, and its ability to stabilize the economy? These are some of the questions that were debated at a recent symposium on “Heterogeneity in Macroeconomics: Implications for Policy” organized by the new Applied Macroeconomics and Econometrics Center (AMEC) of the New York Fed on November 12.
Posted at 7:00 am in Equitable Growth, Inequality, Monetary Policy, Pandemic, Unemployment | Permalink
 RSS Feed
 Follow Liberty Street Economics