Liberty Street Economics
Return to Liberty Street Economics Home Page

3 posts on "inflation disparities"
January 18, 2023

Rural Households Hit Hardest by Inflation in 2021‑22

Illustration: Inflation: does location matter? A U.S. map with a pin dropped in the center.

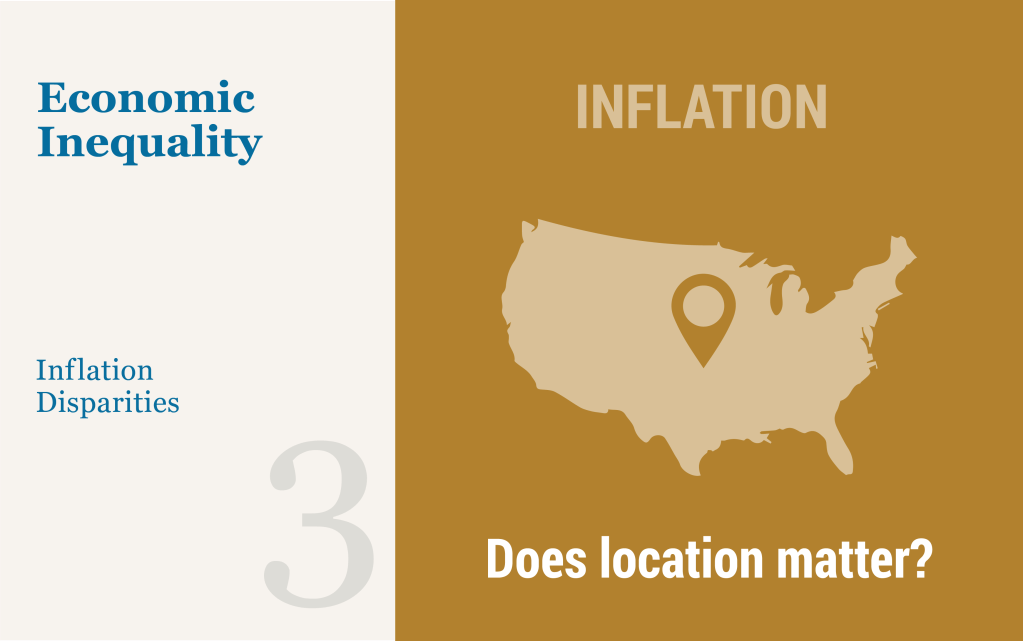
To conclude our series, we present disparities in inflation rates by U.S. census region and rural status between June 2019 and the present. Notably, rural households were hit by inflation the hardest during the 2021-22 inflationary episode. This is intuitive, as rural households rely on transportation, and especially on motor fuel, to a much greater extent than urban households do. More generally, the recent rise in inflation has affected households in the South more than the national average, and households in the Northeast by less than the national average, though this difference has decreased in the last few months. Once again, these changes in inflation patterns can be explained by transportation inflation driving a large extent of price rises during 2021 and much of 2022, with housing and food inflation lately coming to the fore.

Posted at 11:02 am in Equitable Growth, Inequality, Inflation | Permalink

Young, Less Educated Faced Higher Inflation in 2021—But Gaps Now Closed

Illustration: Inflation: what's changed? short arrow with college grad at the top; higher arrow with a non grad at the top.

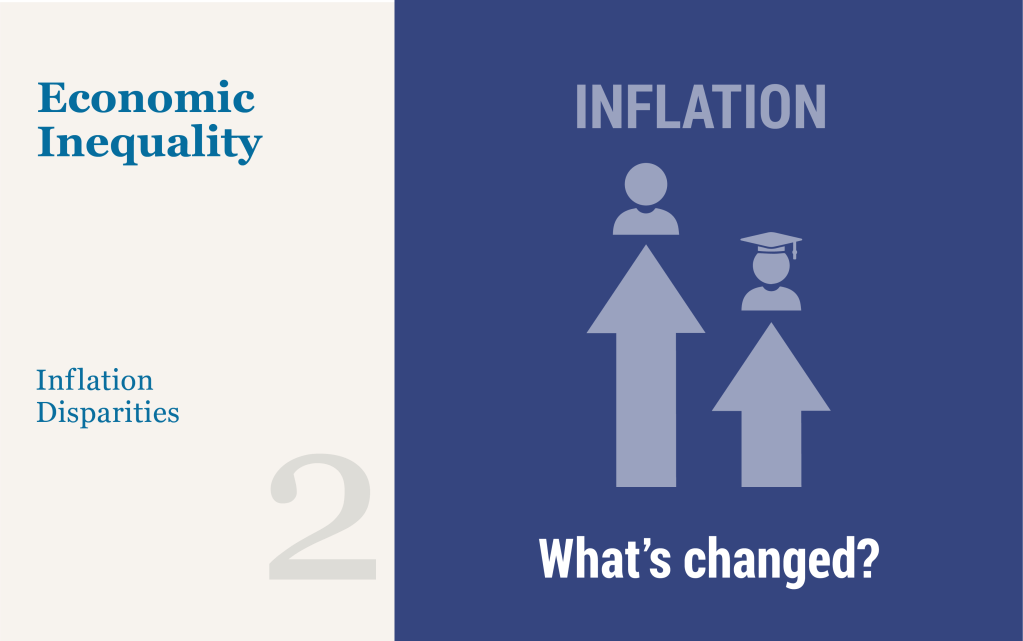
We continue our series on inflation disparities by looking at disparities in inflation rates by educational attainment and age for the period June 2019 to the present. Remarkably, we find that disparities by age and education are considerably larger than those by income and are similar in size to those by race and ethnicity, both explored in our previous post. Specifically, during the inflationary period of 2021-22, younger people and people without a college degree faced the highest inflation, with steadily widening gaps relative to the overall average between early 2021 and June 2022, followed by a rapid narrowing of the gaps and a reversal of some of them by December 2022. This pattern arises primarily from a greater share of the expenditures of younger people and people without a college degree being devoted to transportation—particularly used cars and motor fuel—which led the 2021 inflationary episode but has since converged to general inflation.

Inflation Disparities by Race and Income Narrow

illustration: Inflation: who's more affected now? three races at different levels of a line chart.

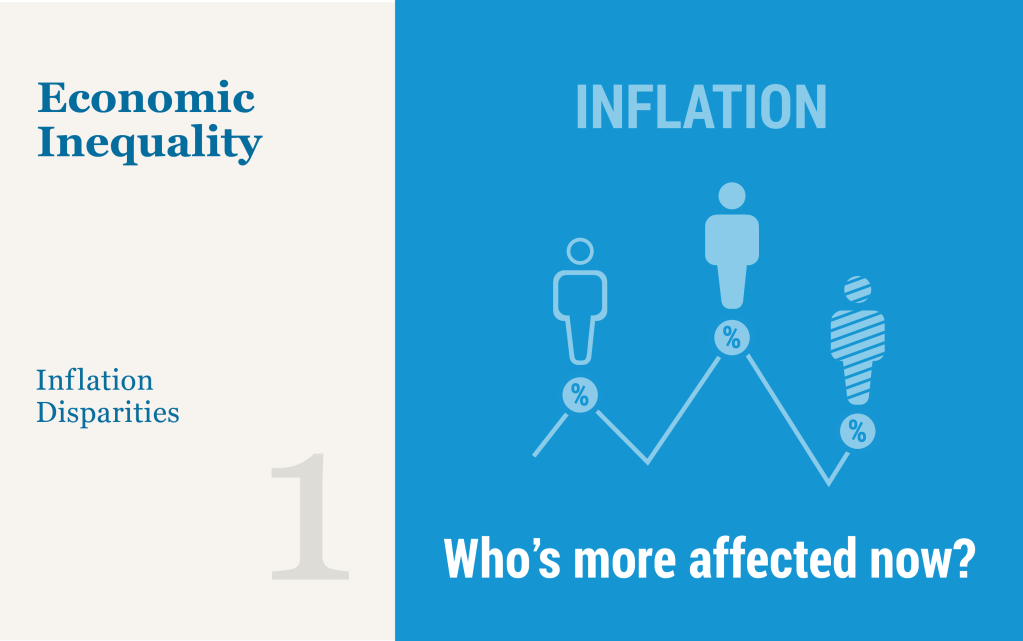
As inflation has risen to forty-year highs, inflation inequality—disparities in the rates of inflation experienced by different demographic and economic groups– has become an increasingly important concern. In this three-part blog series, we revisit our main finding from June—that inflation inequality has increased across racial and ethnic groups—and provide estimates of differential inflation rates across groups based on income, education, age, and geographic location. We also use an updated methodology for computing inflation disparities by focusing on more disaggregated categories of spending, which corroborates our earlier findings and substantiates our conclusion that inflation inequality is a pronounced feature of the current inflationary episode.

About the Blog

Liberty Street Economics features insight and analysis from New York Fed economists working at the intersection of research and policy. Launched in 2011, the blog takes its name from the Bank’s headquarters at 33 Liberty Street in Manhattan’s Financial District.

The editors are Michael Fleming, Andrew Haughwout, Thomas Klitgaard, and Asani Sarkar, all economists in the Bank’s Research Group.

Liberty Street Economics does not publish new posts during the blackout periods surrounding Federal Open Market Committee meetings.

The views expressed are those of the authors, and do not necessarily reflect the position of the New York Fed or the Federal Reserve System.

Economic Research Tracker

Image of NYFED Economic Research Tracker Icon Liberty Street Economics is available on the iPhone® and iPad® and can be customized by economic research topic or economist.

Economic Inequality

image of inequality icons for the Economic Inequality: A Research Series

This ongoing Liberty Street Economics series analyzes disparities in economic and policy outcomes by race, gender, age, region, income, and other factors.

Most Read this Year

Comment Guidelines


We encourage your comments and queries on our posts and will publish them (below the post) subject to the following guidelines:

Please be brief: Comments are limited to 1,500 characters.

Please be aware: Comments submitted shortly before or during the FOMC blackout may not be published until after the blackout.

Please be relevant: Comments are moderated and will not appear until they have been reviewed to ensure that they are substantive and clearly related to the topic of the post.

Please be respectful: We reserve the right not to post any comment, and will not post comments that are abusive, harassing, obscene, or commercial in nature. No notice will be given regarding whether a submission will or will
not be posted.‎

Comments with links: Please do not include any links in your comment, even if you feel the links will contribute to the discussion. Comments with links will not be posted.

Send Us Feedback

Disclosure Policy

The LSE editors ask authors submitting a post to the blog to confirm that they have no conflicts of interest as defined by the American Economic Association in its Disclosure Policy. If an author has sources of financial support or other interests that could be perceived as influencing the research presented in the post, we disclose that fact in a statement prepared by the author and appended to the author information at the end of the post. If the author has no such interests to disclose, no statement is provided. Note, however, that we do indicate in all cases if a data vendor or other party has a right to review a post.

Archives