A Check‑In on the Mortgage Market

Debt balances continued to march upward in the second quarter of 2025, according to the latest Quarterly Report on Household Debt and Credit from the New York Fed’s Center for Microeconomic Data. Mortgage balances in particular saw an increase of $131 billion. Following a steep rise in home prices since 2019, several housing markets have seen dips in prices and concerns were sparked about the state of the mortgage market. Here, we disaggregate mortgage balances and delinquency rates by type and region to better understand the landscape of the current mortgage market, where any ongoing risks may lie, regionally and by product.
Breaking Down Auto Loan Performance

Debt balances continued to rise at a moderate pace in the fourth quarter of 2024, and delinquencies, particularly for auto loans and credit cards, remained elevated, according to the latest Quarterly Report on Household Debt and Credit from the New York Fed’s Center for Microeconomic Data. Auto loan balances have grown steadily since 2011, expanding by $48 billion in 2024. This increase reflects a steady inflow of newly originated auto loan balances, which in 2024 were boosted primarily by originations to very prime borrowers (those with credit scores over 760) while originations to borrowers with midprime and subprime scores held roughly steady. In this post, we take a closer look at auto loan performance and find that delinquencies have been rising across credit score bands and area income levels. We also break down auto loan performance by lender type and find that delinquencies are primarily concentrated in loans from non-captive auto finance companies.
Delinquency Is Increasingly in the Cards for Maxed‑Out Borrowers

This morning, the New York Fed’s Center for Microeconomic Data released the Quarterly Report on Household Debt and Credit for the first quarter of 2024. Household debt balances grew by $184 billion over the previous quarter, slightly less than the moderate growth seen in the fourth quarter of 2023. Housing debt balances grew by $206 billion. Auto loans saw a $9 billion increase, continuing their steady growth since the second quarter of 2020, while balances on other non-housing debts fell. Credit card balances fell by $14 billion, which is typical for the first quarter. However, an increasing number of borrowers are behind on credit card payments. In this post, we explore the relationship between credit card delinquency and changes in credit card “utilization rates.”
The Post‑Pandemic Shift in Retirement Expectations in the U.S.

One of the most striking features of the labor market recovery following the pandemic recession has been the surge in quits from 2021 to mid-2023. This surge, often referred to as the Great Resignation, or the Great Reshuffle, was uncommonly large for an economic expansion. In this post, we call attention to a related labor market change that has not been previously highlighted—a persistent change in retirement expectations, with workers reporting much lower expectations of working full-time beyond ages 62 and 67. This decline is particularly notable for female workers and lower-income workers.
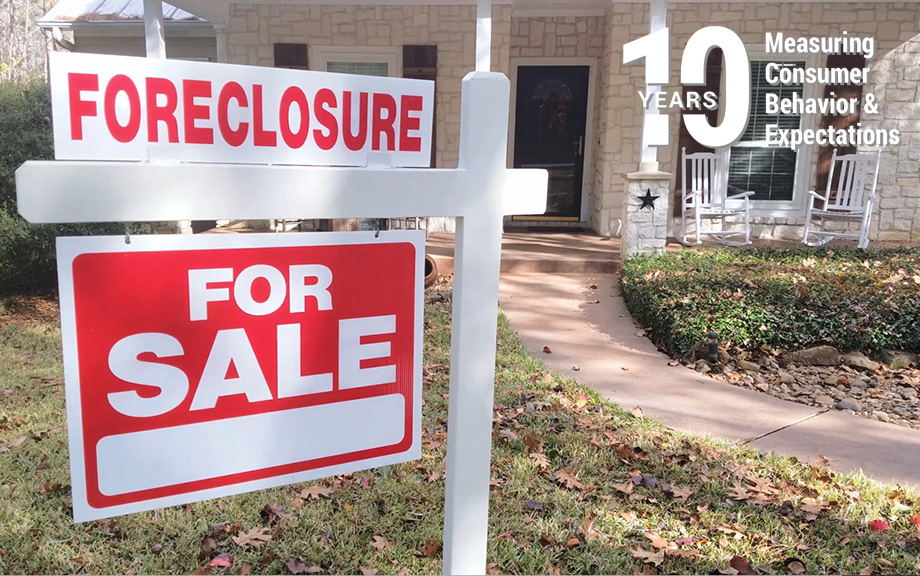
How Are They Now? A Checkup on Homeowners Who Experienced Foreclosure

The end of the Great Recession marked the beginning of the longest economic expansion in U.S. history. The Great Recession, with its dramatic housing bust, led to a wave of home foreclosures as overleveraged borrowers found themselves unable to meet their payment obligations. In early 2009, the New York Fed’s Research Group launched the Consumer Credit Panel (CCP), a foundational data set of the Center for Microeconomic Data, to monitor the financial health of Americans as the economy recovered. The CCP, which is based on anonymized credit report data from Equifax, gives us an opportunity to track individuals during the period leading to the foreclosure, observe when a flag is added to their credit report and then—years later—removed. Here, we examine the longer-term impact of a foreclosure on borrowers’ credit scores and borrowing experiences: do they return to borrowing, or shy away from credit use and homeownership after their earlier bad experience?
Mortgage Rate Lock‑In and Homeowners’ Moving Plans

The U.S. housing market has had a tumultuous few years. After falling to record lows during the pandemic, the average 30-year mortgage rate rapidly increased in 2022 and 2023 and now hovers near a two-decade high of 7.2 percent. For those that locked in a low mortgage rate prior to 2022, this steep increase has significantly increased the cost of moving, as taking out a mortgage at current rates would potentially increase their monthly housing payment by hundreds or thousands of dollars, even if the amount they borrowed remained unchanged. As shown by Ferreira et al. (2011), this lock-in effect has the potential to reduce geographic mobility and turnover in the housing market and has gained the attention of Federal Reserve leaders. In this post, we utilize special questions from the Federal Reserve Bank of New York’s 2023 and 2024 SCE Housing Surveys to estimate the extent to which mortgage rate lock-in is suppressing U.S. household’s moving plans.
The New York Fed Consumer Credit Panel: A Foundational CMD Data Set

As the Great Financial Crisis and associated recession were unfolding in 2009, researchers at the New York Fed joined colleagues at the Board of Governors and Philadelphia Fed to create a new kind of data set. Household liabilities, particularly mortgages, had gone from being a quiet little corner of the financial system to the center of the worst financial crisis and sharpest recession in decades. The new data set was designed to provide fresh insights into this part of the economy, especially the behavior of mortgage borrowers. In the fifteen years since that effort came to fruition, the New York Fed Consumer Credit Panel (CCP) has provided many valuable insights into household behavior and its implications for the macro economy and financial stability.
The CCP was one of the first data sets drawn from credit bureau data, one of the earliest features of the Center for Microeconomic Data (CMD), and the primary source material for some of the CMD’s most important contributions to policy and research. Here we review a few of the main household debt themes over the past fifteen years, and how our analyses contributed to their understanding.
Consumers’ Perspectives on the Recent Movements in Inflation
Editors Note: The title of this post has been changed from the original. August 17, 2023, 10:35 a.m.

Inflation in the U.S. has experienced unusually large movements in the last few years, starting with a steep rise between the spring of 2021 and June 2022, followed by a relatively rapid decline over the past twelve months. This marks a stark departure from an extended period of low and stable inflation. Economists and policymakers have expressed differing views about which factors contributed to these large movements (as reported in the media here, here, here, and here), leading to fierce debates in policy circles, academic journals, and the press. We know little, however, about the consumer’s perspective on what caused these sudden movements in inflation. In this post, we explore this question using a special module of the Federal Reserve Bank of New York’s Survey of Consumer Expectations (SCE) in which consumers were asked what they think contributed to the recent movements in inflation. We find that consumers think supply-side issues were the most important factor behind the 2021-22 inflation surge, while they regard Federal Reserve policies as the most important factor behind the recent and expected future decline in inflation.
Credit Card Markets Head Back to Normal after Pandemic Pause

Total household debt balances increased by $16 billion in the second quarter of 2023, according to the latest Quarterly Report on Household Debt and Credit from the New York Fed’s Center for Microeconomic Data. This reflects a modest rise from the first quarter. Credit card balances saw the largest increase of all debt types—$45 billion—and now stand at $1.03 trillion, surpassing $1 trillion in nominal terms for the first time in the series history. After a sharp contraction in the first year of the pandemic, credit card balances have seen seven quarters of year-over-year growth. The second quarter of 2023 saw a brisk 16.2 percent increase from the previous year, continuing this strong trend. With credit card balances at historic highs, we consider how lending and repayment have evolved using the New York Fed’s Consumer Credit Panel (CCP), which is based on anonymized Equifax credit report data.


 RSS Feed
 Follow Liberty Street Economics