


The increasing dominance of large firms in the United States has raised concerns about pricing power in the product market. The worry is that large firms, facing fewer competitors, could increase their markups over marginal costs without fear of losing market share. In a recently published paper, we show that although sales of domestic firms have become more concentrated in the manufacturing sector, this development has been accompanied by the entry and growth of foreign firms. Import competition has lowered U.S. producers’ share of the U.S. market and put smaller, less efficient domestic firms out of business. Overall, market concentration in manufacturing was stable in recent decades, though import penetration has greatly altered the makeup of the U.S. manufacturing sector.
Measuring Concentration
Many previous studies have focused on what we refer to as production concentration, which is measured as the sales of the largest U.S. producers as a share of total production in the U.S. That is, it does not take account of imported goods, but does include U.S. firms’ exports. As shown in the charts below, the production concentration of the top-four or top-twenty firms has increased between 1992 and 2012 (blue lines). For questions related to market power in the labor market, the evolution of production concentration is indeed relevant. However, for questions related to market power in the product market, we need to take into account the sales of foreign exporters in the United States (and exclude U.S. firms’ sales abroad). We refer to this measure of concentration as market concentration. The chart below shows that the largest firms’ (which could be U.S. or foreign) share of total sales (inclusive of sales by foreign firms) in U.S. manufacturing industries has been flat in the aggregate (red lines). The construction of market concentration, using the full sales distribution, was only made possible by accessing confidential census data, which report the sales in the U.S. of both domestic firms and foreign exporters.
U.S. Production Concentration Has Risen, but Overall Market Concentration Has Remained Flat
Top-4 market share
Top-20 market share
Note: Concentration measures are simple averages across 169 industries at the five-digit North American Industry Classification (NAICS) level.
We illustrate the loss in U.S. firms’ market shares in the chart below, by plotting the distribution of the market shares of foreign firms (in red) and domestic firms (in blue) that are in the top-20 across industries in 1992 (solid lines) and in 2012 (dashed lines). To construct the graph, we take the top 20 firms in each industry, and identify among them the domestic and foreign firms. For any given market share, the height of the blue curve reflects the number of industries where the domestic firms have that market share, and analogously the red curve is for the foreign firms’ market shares.
Two main points stand out. First, the shift to the left of the blue line highlights the fall in the market share of domestic firms between 1992 and 2012. In the average industry, domestic firms in the top-20 had a market share of only about 40 percent in 2012 compared to 50 percent in 1992, which can be seen by comparing the peak of the curves.
Second, the shift to the right in the red line shows that foreign firms have gained some market share in the top-20 during our sample period: the share of industries where foreign firms in the top-20 have a near-zero market share has fallen, while the share of industries where foreign firms have a greater market share than 20 percent has risen. Despite this rise, it is important to note that in many industries the market share of foreign firms in the top-20 is still low: the aggregate market share of foreign firms in manufacturing sales is less than 4 percent in 2012. In our previous post, we showed that most of the foreign firms’ gains occurred at the bottom of the market share distribution.
Foreign Firms Have Gained Some Market Share in the Top 20
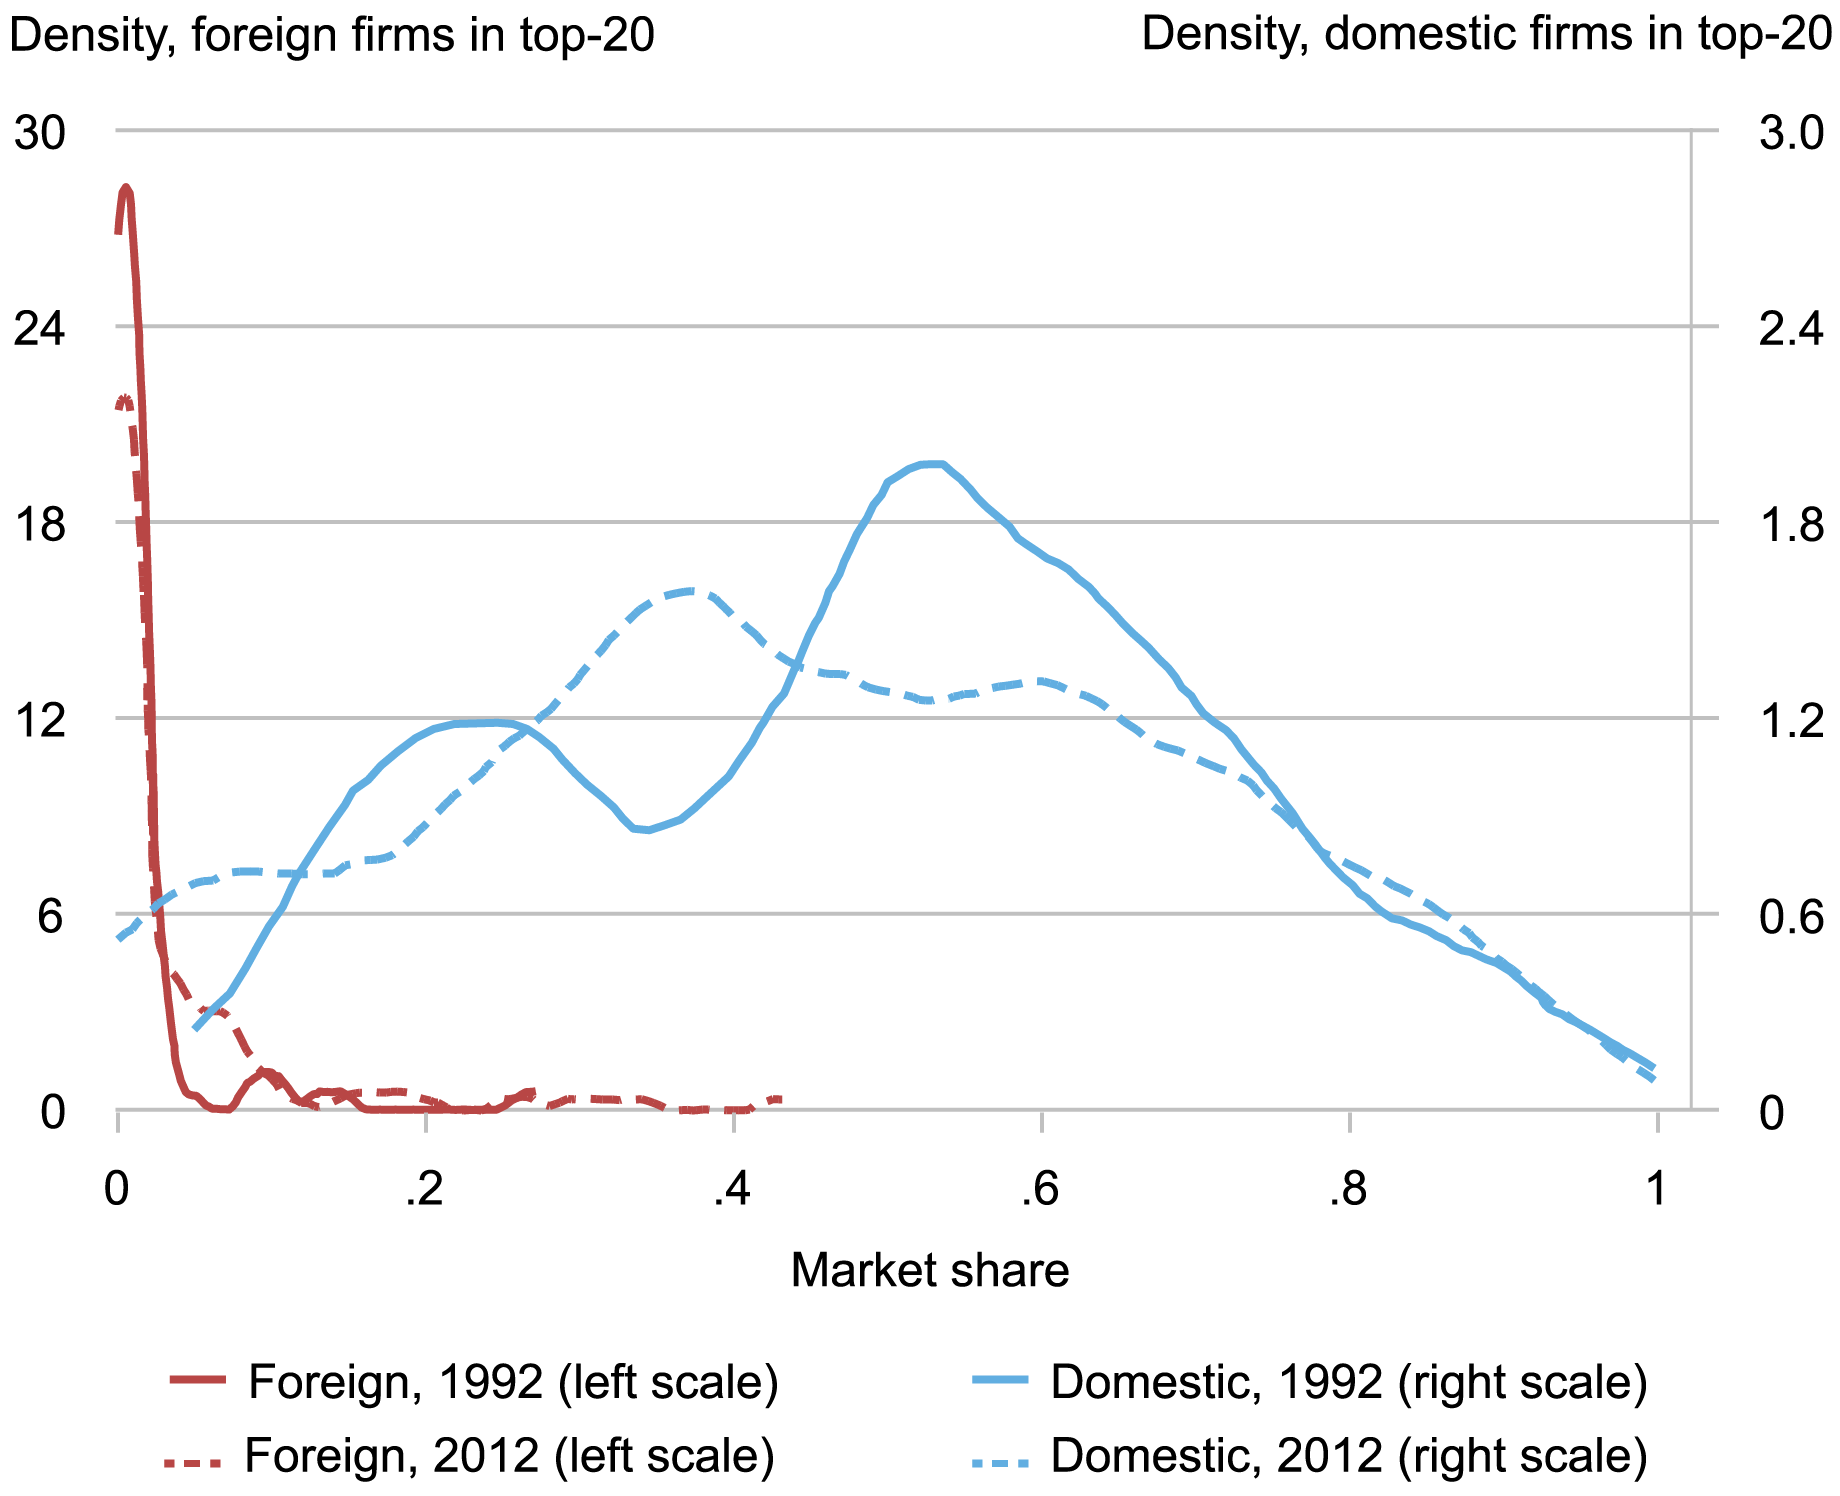
Notes: We exclude industries with no foreign firms in the top-20 from the foreign densities to zoom in on industries with a foreign firm presence. The number of industries with no foreign firms in the top-20 fell from one half to one third of all manufacturing industries during our sample period.
Is there a causal link between the rise in import competition and the concentration patterns we observe? Over the last few decades, U.S. manufacturing firms have become more exposed to foreign competition: import penetration (defined as the share of imports in domestic sales) has risen by about 10 percentage points between 1992 and 2012, from 10 percent to 20 percent. Our regression analysis shows that, in the average industry, a 10 percentage point increase in import penetration has caused a 2.1 percentage point rise in production concentration (see table below). Intuitively, an increase in import competition leads small, less efficient domestic firms to lose market share relative to larger, more efficient domestic firms. As a result, production concentration rises. We find that this effect is strongest in industries where goods are close substitutes.
Rising import penetration reduced the sales of U.S. firms as a share of the overall U.S. market (inclusive of foreign firms’ sales). However, this effect was nearly completely offset by the market share gains of foreign firms. Our estimates indicate that a 10 percentage point increase in import penetration increased the market share of foreign firms in the top-20 by 3.8 percentage points, while lowering the market share of domestic firms in the top-20 by 3.4 percentage points. As a result, market concentration remained virtually unchanged. We also find that rising import penetration has reduced the number of U.S. firms in manufacturing industries, as inefficient producers have been replaced by foreign firms.
Rising Import Penetration Caused Domestic Firms to Lose Market Share to Foreign Firms
| Effect of a 10 Percentage Point Change in Import Penetration | |
| Production concentration | +2.1** |
| Market share of domestic firms in top-20 | -3.4*** |
| Market share of foreign firms in top-20 | +3.8*** |
| Market concentration | +0.4 |
| Number of domestic firms (percent) | -23.0*** |
Notes: The reported numbers are from regression tables in Amiti and Heise “U.S. Market Concentration and Import Competition,” Review of Economic Studies, April 2024. Three stars indicate significance at the 1 percent level; 2 stars indicate significance at the 5 percent level. All figures are percentage points unless otherwise specified.
In summary, our results show that import competition has contributed to increased production concentration due to a reallocation of market share from small domestic firms to large ones. At the same time, greater import competition reduced the overall market share of U.S. firms and increased that of foreign firms, resulting in stable market concentration. Interpreted through the lens of standard trade models, which imply a positive relationship between market shares and markups, our finding that U.S. firms’ market share has fallen suggests that the market power of U.S. manufacturing firms may actually have declined over the past few decades.

Mary Amiti is the head of Labor and Product Market Studies in the Federal Reserve Bank of New York’s Research and Statistics Group.

Sebastian Heise is a research economist in Labor and Product Market Studies in the Federal Reserve Bank of New York’s Research and Statistics Group.
How to cite this post:
Mary Amiti and Sebastian Heise, “Has Market Concentration in U.S. Manufacturing Increased? ,” Federal Reserve Bank of New York Liberty Street Economics, May 3, 2024, https://libertystreeteconomics.newyorkfed.org/2024/05/has-market-concentration-in-u-s-manufacturing-increased/.


Disclaimer
The views expressed in this post are those of the author(s) and do not necessarily reflect the position of the Federal Reserve Bank of New York or the Federal Reserve System. Any errors or omissions are the responsibility of the author(s).
 RSS Feed
 Follow Liberty Street Economics