


120 posts from "2023"
November 8, 2023
Comparing Physical Risk: The Fed’s Second District versus the Nation

In this post, we discuss the climate-related risks faced by the Federal Reserve’s Second District and compare these with risks faced by the nation as a whole. The comparison helps contextualize the risks while framing them in the broader context of a changing climate at the national level. We show that the continental Second District—an area consisting of New York State, the twelve northern-most counties of New Jersey, and Fairfield County in Connecticut—faces fewer and less severe climate-related physical risks than the nation as a whole. However, the areas that comprise the Second District still rank somewhat high in key risks that include “heat stress.” This holds true especially for New York City.
Blog Series on the Economic and Financial Impacts of Extreme Weather Events in the Fed’s Second District
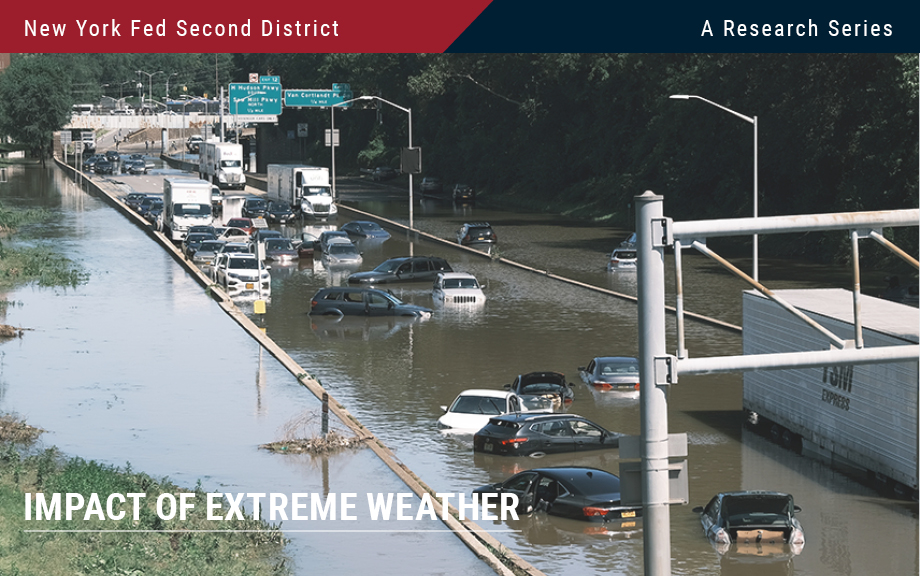
The frequency and ferocity of extreme weather events, such as flooding, storms, and deadly heat waves, have been on the rise in recent years. These climate events, along with human adaption to cope with them, may have large effects on the economy and financial markets. It is therefore paramount to provide research about the economy’s vulnerability to climate events for policymakers, households, financial institutions, and other players in the world economy to make informed decisions. In the coming days, we are going to present a series of nine posts that attempt to take a step in this direction while focusing on the Federal Reserve System’s Second District (NY, northern NJ, southwest CT, Puerto Rico, and the U.S. Virgin Islands). The twelve Federal Reserve Districts are depicted in this map.
November 7, 2023
Credit Card Delinquencies Continue to Rise—Who Is Missing Payments?

This morning, the New York Fed’s Center for Microeconomic Data released the 2023:Q3 Quarterly Report on Household Debt and Credit. After only moderate growth in the second quarter, total household debt balances grew $228 billion in the third quarter across all types, especially credit cards and student loans. Credit card balances grew $48 billion this quarter and marked the eighth quarter of consecutive year-over year increases. The $154 billion nominal year-over-year increase in credit card balances marks the largest such increase since the beginning of our time series in 1999. The increase in balances is consistent with strong nominal spending and real GDP growth over the same time frame. But credit card delinquencies continue to rise from their historical lows seen during the pandemic and have now surpassed pre-pandemic levels. In this post, we focus on which groups have fallen behind on debt payments and discuss whether rising delinquencies are narrowly concentrated or broad based.
Posted at 11:00 am in Household Finance | Permalink
November 6, 2023
Banking System Vulnerability: 2023 Update

The bank failures that occurred in March 2023 highlighted how unrealized losses on securities can make banks vulnerable to a sudden loss of funding. This risk, which materialized following the rapid rise in interest rates that began in early 2022, underscores the importance of monitoring the vulnerabilities of the banking system. In this post, as in previous years, we provide an update of four analytical models aimed at capturing different aspects of vulnerability of the U.S. banking system, with data through the second quarter of 2023. In addition, we discuss changes made to the methodology based on the lessons from March 2023 and assess how the system-level vulnerability has evolved.
Posted at 7:00 am in Bank Capital, Banks, Financial Institutions, Liquidity, Systemic Risk | Permalink | Comments (2)
October 19, 2023
Can China Catch Up with Greece?

China’s leader Xi Jinping recently laid out the goal of reaching the per capita income of “a mid-level developed country by 2035.” Is this goal likely to be achieved? Not in our view. Continued rapid growth faces mounting headwinds from population aging and from diminishing returns to China’s investment-centered growth model. Additional impediments to growth appear to be building, including a turn toward increased state management of the economy, the crystallization of legacy credit issues in real estate and other sectors, and limits on access to key foreign technologies. Even given generous assumptions concerning future growth fundamentals, China appears likely to close only a fraction of the gap with high-income countries in the years ahead.
October 18, 2023
Borrower Expectations for the Return of Student Loan Repayment
After forty-three months of forbearance, the pause on federal student loan payments has ended. Originally enacted at the onset of the COVID-19 pandemic in March 2020, the administrative forbearance and interest waiver lasted until September 1, 2023, and borrowers’ monthly payments resumed this month. As discussed in an accompanying post, the pause on student loan payments afforded borrowers over $260 billion in waived payments throughout the pandemic, supporting borrowers’ consumption and savings over the last three years. In this post, we analyze responses of student loan borrowers to special questions in the August 2023 SCE Household Spending Survey designed to gauge the expected impact of the payment resumption on future spending growth, the risk of credit delinquency for borrowers, and the economy at large. The findings suggest that the payment resumption will have a relatively small overall effect on consumption, on the order of a 0.1 percentage point reduction in aggregate spending from August levels, and a (delayed) return of student loan delinquency rates back to pre-pandemic levels. Across groups, we see little variation in spending responses but find that low-income borrowers, female borrowers, those with less than a bachelor’s degree, and those who were not in repayment before the pandemic expect the highest likelihood of missed student loan payments.
An Update on the Health of the U.S. Consumer

The strength of consumer spending so far this year has surprised most private forecasters. In this post, we examine the factors behind this strength and the implications for consumption in the coming quarters. First, we revisit the measurement of “excess savings” that households have accumulated since 2020, finding that the estimates of remaining excess savings are very sensitive to assumptions about measurement, estimation period, and trend type, which renders them less useful. We thus broaden the discussion to other aspects of the household balance sheet. Using data from the New York Fed’s Consumer Credit Panel, we calculate the additional cash flows made available for consumption as a result of households’ adjustments to their debt holdings. To detect signs of stress in household financial positions, we examine recent trends in delinquencies and find the evidence to be mixed, suggesting that certain stresses have emerged for some households. In contrast, we find that the New York Fed’s Survey of Consumer Expectations still points to a solid outlook for consumer spending.
October 17, 2023
How Has Treasury Market Liquidity Evolved in 2023?

In a 2022 post, we showed how liquidity conditions in the U.S. Treasury securities market had worsened as supply disruptions, high inflation, and geopolitical conflict increased uncertainty about the expected path of interest rates. In this post, we revisit some commonly used metrics to assess how market liquidity has evolved since. We find that liquidity worsened abruptly in March 2023 after the failures of Silicon Valley Bank and Signature Bank, but then quickly improved to levels close to those of the preceding year. As in 2022, liquidity in 2023 continues to closely track the level that would be expected by the path of interest rate volatility.
October 16, 2023
Racial Discrimination in Child Protective Services
Childhood experiences have an enormous impact on children’s long-term societal contributions. Experiencing childhood maltreatment is associated with compromised physical and mental health, decreased educational attainment and future earnings, and increased criminal activity. Child protective services is the government’s way of endeavoring to protect children. Foster care consequently has large potential effects on a child’s future education, earnings, and criminal activity. In this post, we draw on a recent study to document disparities in the likelihood that children of different races will be placed into foster care.
October 12, 2023
Do Large Firms Generate Positive Productivity Spillovers?

Numerous studies have documented the rising dominance of large firms over the last few decades in many industrialized countries. Many research papers have focused on the potential negative effects of this increased market concentration, raising concerns about market power in both labor and product markets. In a new study, we investigate whether large firms also generate positive effects. Our research shows that large firms generate significant positive total factor productivity (TFP) spillovers to their domestic suppliers. To date, these types of spillovers have only been identified for multinational enterprises located in developing countries. Using firm-to-firm transaction data for an industrialized country, Belgium, we find that large domestic firms, as well as multinationals, generate positive TFP spillovers.
Posted at 7:00 am in Macroeconomics | Permalink
 RSS Feed
 Follow Liberty Street Economics