











Total debt balances declined slightly by $13 billion in the second quarter of 2026, according to the latest Quarterly Report on Household Debt and Credit from the New York Fed’s Center for Microeconomic Data. Mortgage and student loan balances saw a small decline, while there were increases across other debt products. Delinquency rates across most products remained fairly stable. Still, between 2022:Q3 and 2026:Q1, the percentage of credit card balances 90+ days delinquent rose from 7.6 percent to 12.8 percent, prompting concerns that Americans are falling behind on their debt payments at rates not seen since the Great Recession. Yet the flow delinquency rate—which captures the rate of new delinquencies—has remained relatively stable for almost two years. In this post, we use data from the New York Fed Consumer Credit Panel (CCP) to better understand the state of the consumer, and to explain the difference between our two measures of delinquency. We find that the stock delinquency rate is rising because of a pool of stale, charged-off debts that lenders have been reporting for longer durations, rather than a fundamental worsening in the incidence of delinquency.
Diverging Stories of Loan Performance
The chart below presents three different delinquency measures: two delinquency time series from the Quarterly Report, contrasted with a delinquency rate aggregated from Call Reports and published by the Board of Governors. The blue line (“stock” delinquency rate) is computed as the share of outstanding balance actively reported on credit reports that is 90+ days past due, while the Board’s delinquency rate is calculated as the share of outstanding balance on lenders’ balance sheets that is 30+ days past due.
We additionally overlay the flow into 90+ days past due from our Quarterly Report (also known as new transitions into delinquency). This figure is calculated as the balance on loans that became 90+ days past due in the present quarter divided by the balance of loans that were less than 90 days past due in the previous quarter, annualized using a four-quarter moving sum. The trends in the Call Report series, in gold, and the flow series, in red, are very similar, as both have leveled off recently, while the blue line, depicting stock delinquency, has been rising steadily since about 2023.
The Stock Delinquency Rate on Credit Reports Continued Rising Post-2024 While Flow Delinquency Aligns More Closely with Lender Reports
Percent of balance
Notes: The blue line plots the stock delinquency rate, computed as the sum of balances in the CCP 90+ days past due divided by the sum of all outstanding balances. The red line plots the flow delinquency rate, computed as the sum of balances in the CCP each quarter that newly became 90+ days past due divided by the total balance that was less than 90 days past due or current in the previous quarter. The flow delinquency rate is annualized using a four-quarter moving sum. The gold line shows the share of non-charged-off balances 30+ days past due from the Board of Governors Call Reports.
It may seem surprising that the CCP stock delinquency rate is consistently higher than the Board’s delinquency rate, which includes even early-stage delinquent loans (30-89 days past due). This difference comes down to what happens after a loan becomes very delinquent. In lender-reported figures, when a loan is charged-off—typically between 120 and 180 days past due—the balance comes off the lenders’ books, exiting both the numerator and the denominator. The charge-off registers once, in the period it occurs, and then it is gone. However, borrowers generally still owe these debts, and lenders may continue to pursue them and update the credit bureaus accordingly. We include these debts in our stock delinquency rate as they remain part of the borrower’s debt burden.
This distinction also explains why the stock and flow delinquency rates have moved differently. The dynamics of the stock delinquency rate are driven by three factors: (1) the pace at which new debts become delinquent, which the flow rate captures; (2) the rate at which existing delinquent debts cure back to current; and (3) the length of time that older charged off debts remain in the data. During the post-pandemic period, new delinquencies accelerated, pushing the stock and flow rates up together. However, when the pace of new delinquencies stabilized in early 2024, the stock kept rising as charged-off debts accumulated. To illustrate this, we disaggregate the stock delinquency rate in the chart below into its three underlying delinquency buckets, and find that the recent rise has been driven almost entirely by a growing pool of severely derogatory (charged off) balances.
The Rise in the Stock Delinquency Rate Has Been Driven by Severely Derogatory Balances
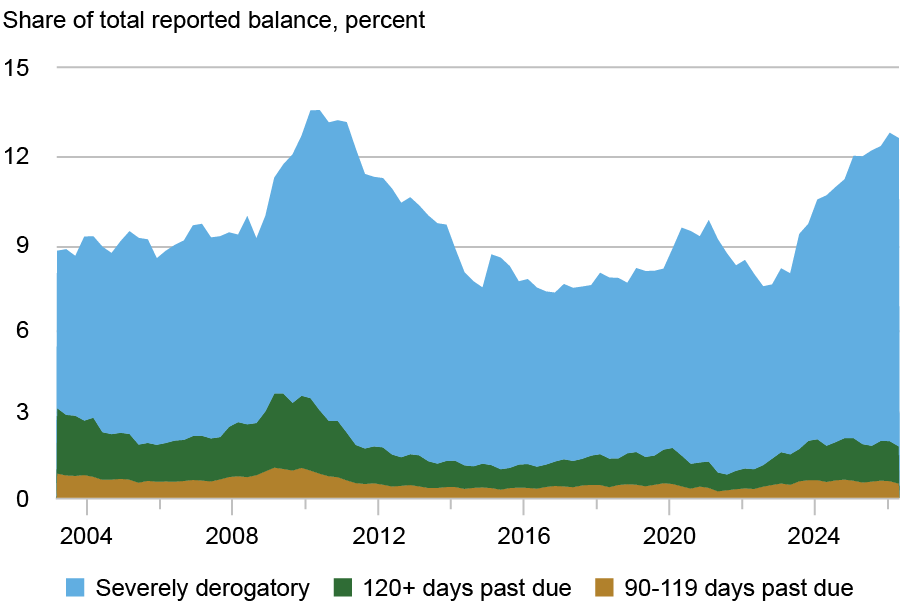
Note: “Severely derogatory” corresponds largely to balances associated with credit card accounts that lenders have noted as charged-off.
Part of the reason these charged-off balances have accumulated is that lenders are actively reporting them to credit bureaus for longer than they used to. Between 2004 and 2012, only about 40 percent of borrowers’ charged-off debts were still being reported one year later; by 2024, this figure had doubled to 80 percent. One possible explanation is that lenders are having less success collecting on these debts, leaving more of them outstanding—though recovery rates reported by the CFPB have only changed slightly, suggesting that this is unlikely to be an important factor. Alternatively, lender reporting practices may have changed in a way that is uncorrelated with debt performance.
Below, we remove the charged-off (severely derogatory) balances from our stock delinquency rate. When we do this, the stock delinquency rate falls in line with both our flow delinquency rate and the Call Report delinquency rate.
Reconciling the Divergence: After Dropping Charged-Off Debt, All Measures of Credit Card Delinquency Remain Stable After 2024
Percent of balance
Note: The red line shows the flow delinquency rate, which is calculated as the total balance in the CCP each quarter that newly became 90+ days past due divided by the total balance that was less than 90 days past due or current from the previous quarter. The flow delinquency rate is annualized using a four-quarter moving sum. The gold line shows the share of non-charged-off balances 30+ days past due from the Board of Governors Call Reports. The blue line shows the sum of balances in the CCP 90+ days past due divided by the sum of all outstanding balances, with severely derogatory (charged off) debts excluded from both the numerator and denominator.
In this post, we revisit our previous work which explained differences in delinquency rates and has become of greater interest due to the recent growing divergence between the stock and flow delinquency rates. The stock delinquency rate remains useful for gauging how much debt is owed to lenders and how much is delinquent—and it is especially relevant for the more than 23 million Americans still carrying charged-off credit card balances on their credit reports. However, when the question is “how are households doing right now?” the flow delinquency rates—shown on pages 13 and 14 of the Quarterly Report–provide a more accurate view of current consumer repayment behavior. By those measures, we find that the pace of credit card delinquency is elevated but has been largely stable since 2024. We will continue to monitor the health of the consumer balance sheet in the coming months.

Donghoon Lee is an economic research advisor in the Federal Reserve Bank of New York’s Research and Statistics Group.

Daniel Mangrum is a research economist in the Federal Reserve Bank of New York’s Research and Statistics Group.

Joelle Scally is an economic policy advisor in the Federal Reserve Bank of New York’s Research and Statistics Group.

Tejas Sinha is a research analyst in the Federal Reserve Bank of New York’s Research and Statistics Group.

Wilbert van der Klaauw is an economic research advisor in the Federal Reserve Bank of New York’s Research and Statistics Group.
How to cite this post:
Donghoon Lee, Daniel Mangrum, Joelle W. Scally, Tejas Sinha, and Wilbert van der Klaauw, “How Distressed Are Consumers? Reconciling Diverging Credit Card Delinquency Measures,” Federal Reserve Bank of New York Liberty Street Economics, August 11, 2026, https://doi.org/10.59576/lse.20260811
BibTeX: View |


Disclaimer
The views expressed in this post are those of the author(s) and do not necessarily reflect the position of the Federal Reserve Bank of New York or the Federal Reserve System. Any errors or omissions are the responsibility of the author(s).

 RSS Feed
 Follow Liberty Street Economics

Thank you for your comment –- economic measurement is challenging and it’s important that we choose the appropriate computation to address the issue. Hopefully this post has helped with clarifying when to choose which data series. An important feature of consumer credit reports and our Quarterly Reports is that they provide information from the borrowers’ (as opposed to lenders’) perspective, capturing what is reported on their credit reports as debt they owe and its delinquency status. These household balance sheet measures are presumably those that drive household spending and other decisions.
Please see our previous blog post on this topic, “Mind the Gap in Delinquency Rates,” if you have further questions.
The 90+ delinquency stock chart is not useful at all, particularly if the banks changed what they are reporting as delinquent over the time period. It’s not an apples to apples comparison and very misleading to readers of the quarterly household debt report. That chart has been posted all over social media implying that consumers were increasingly stressed in making monthly credit card payments which is inaccurate.