











Stablecoins are digital assets whose value is pegged to that of a fiat currency, typically the U.S. dollar at a peg of $1.00 per token. In a previous blog post, we described the rapid growth of stablecoins through early 2025, highlighted changes in stablecoins’ reserve-asset composition, and examined their reactions to Bitcoin price shocks. In this post, we document the growth of stablecoins since our last post. Then, we examine how shocks from outside the crypto industry can impact the composition of stablecoins’ reserve assets. For our case study, we use the 2023 failure of Silicon Valley Bank (SVB) and its impact on USD Coin (USDC, issued by Circle), the second-largest stablecoin by market capitalization.
Recent Growth of Stablecoins
Since our last post in April 2025, the market capitalization of U.S. dollar stablecoins has increased by $71 billion (30 percent) to about $308 billion recently, as shown in the chart below. This period coincides with the passage of the GENIUS Act in July 2025, which established the first federal regulatory framework for payment stablecoins.
Stablecoin Market Capitalization
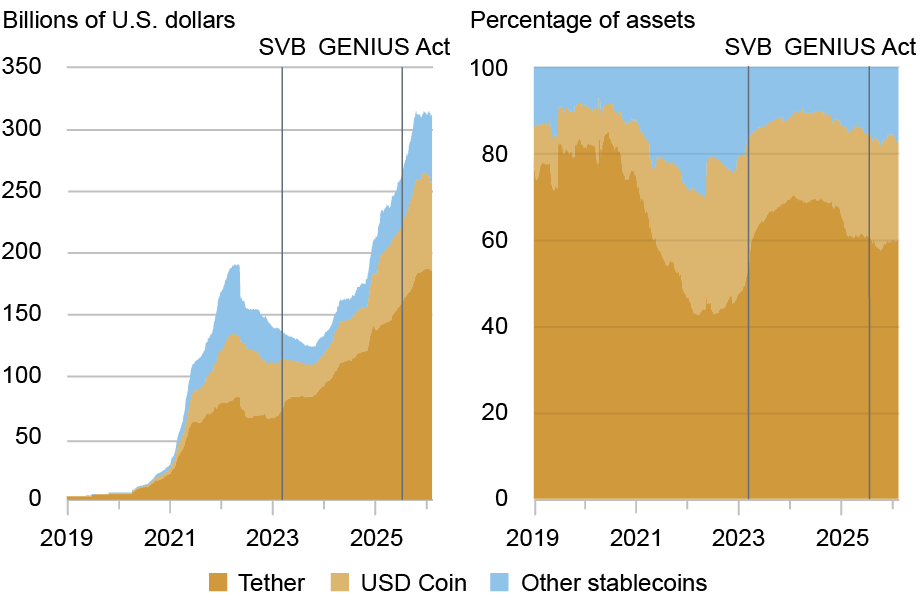
Note: The vertical lines indicate, respectively, SVB’s failure in March 2023 and the passage of the GENIUS Act in July 2025.
The stablecoin industry remains highly concentrated, with the two largest issuers, Tether (USDT) and USDC, accounting for over 80 percent of industry assets. The reserve composition of these stablecoins differs significantly: USDC’s attested reserves consist primarily of cash and short-term U.S. government securities. In contrast, corporate bonds, gold bars, Bitcoin, secured loans, and “other investments” accounted for nearly 24 percent of USDT’s attested reserves as of December 2025.
Reserve-Asset Composition and External Shocks
In prior posts, we examined the impact of positive and negative crypto price shocks on net flows into stablecoins. Here we study a complementary question: how do non-crypto shocks affect net flows into stablecoins and the composition of their reserve assets? This question is important given stablecoins’ increasing interconnectedness with traditional financial markets. To answer it, we document the changes in USDC’s reserve assets following SVB’s failure in March 2023.
On March 11, 2023, Circle reported that approximately 8 percent of USDC’s reserves were held at SVB, which had been placed into FDIC receivership the previous day. Following Circle’s announcement, USDC’s secondary market price dropped considerably below $1.00, and it experienced notable net outflows. In addition to these effects, the composition of the Circle Reserve Fund (CRF), a money market mutual fund (MMF) whose shares can only be purchased by Circle, changed significantly. (The CRF accounts for approximately 86 percent of USDC’s reserve assets as of March 2026.)
The chart below reports the weighted average maturity (WAM)—a measure of interest-rate sensitivity—for the CRF versus the median U.S. Treasury-only (TO) MMF. Prior to SVB’s collapse, the CRF’s WAM exceeded that of the median TO MMF. Following SVB’s failure, the CRF’s WAM fell below that of the median TO fund and has remained below the 5th percentile of the WAM distribution of TO MMFs. Thus, following SVB’s failure, the CRF reduced its interest-rate risk exposure, on balance.
Weighted Average Maturity: Circle Reserve Fund vs. Treasury-Only MMFs
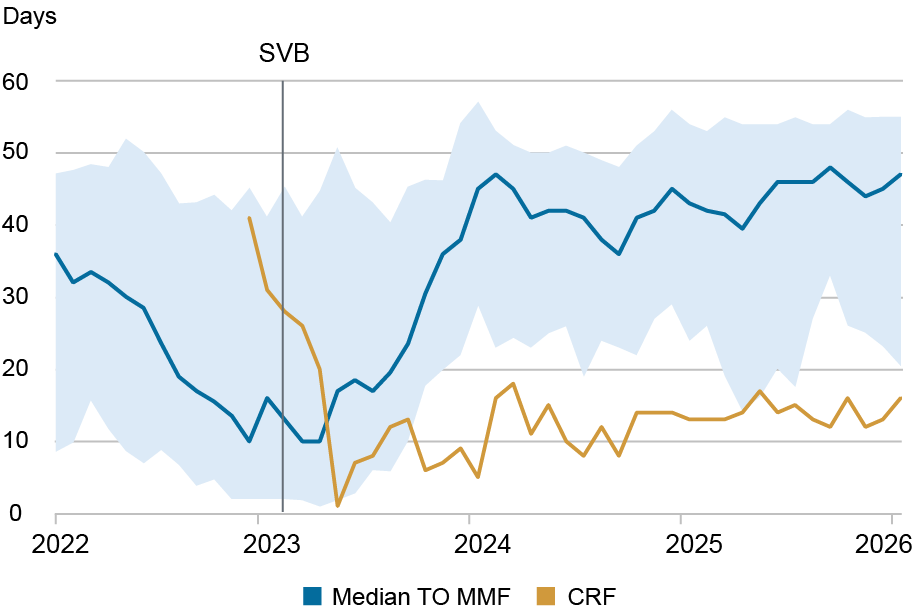
Notes: The data are at a monthly frequency. “TO MMF”: Treasury-Only MMF. “CRF”: Circle Reserve Fund (inception date is November 2022). The light-blue shaded area denotes the 5th to the 95th percentile range of the WAM distribution among TO MMFs. The vertical line indicates when SVB failed in March 2023.
Turning to portfolio composition, the charts below show that, following SVB’s collapse, the CRF’s holdings of repurchase agreements (repos) spiked from zero to over 90 percent of its net assets. This share has since retreated some but still stands at 69 percent, above the distribution of TO MMFs’ repo holdings as a share of net assets. Thus, following the SVB shock, the CRF reduced its interest-rate risk exposure and substantially restructured its counterparty risk exposure.
Repo Holdings: Circle Reserve Fund vs. Treasury-Only MMFs
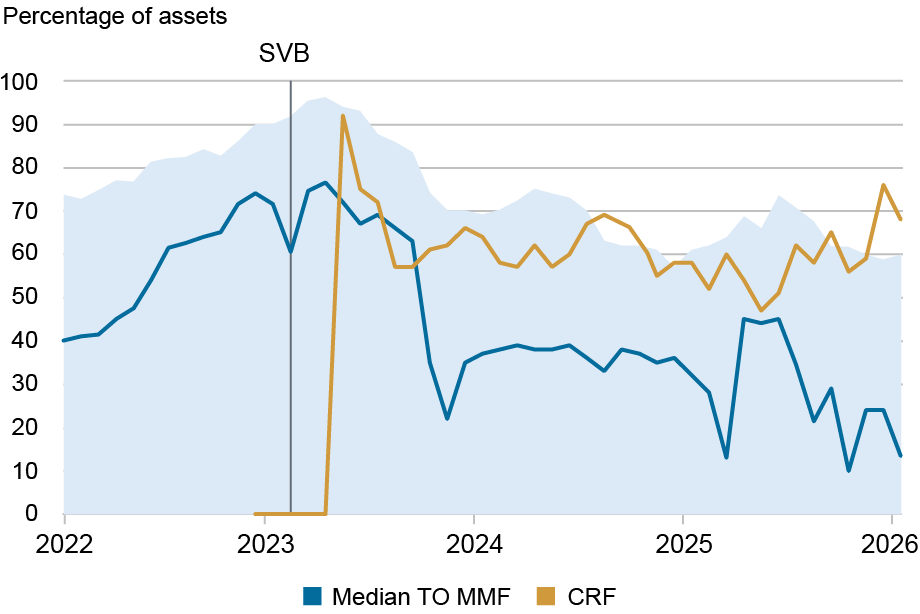
Notes: The data are at a monthly frequency. “TO MMF”: Treasury-Only MMF. “CRF”: Circle Reserve Fund (inception date is November 2022). The light-blue shaded area denotes the 5th to the 95th percentile range of repo holdings as a percentage of net assets among TO MMFs. The vertical line indicates when SVB failed in March 2023.
Circle Reserve Fund’s Repo Holdings by Counterparty Type
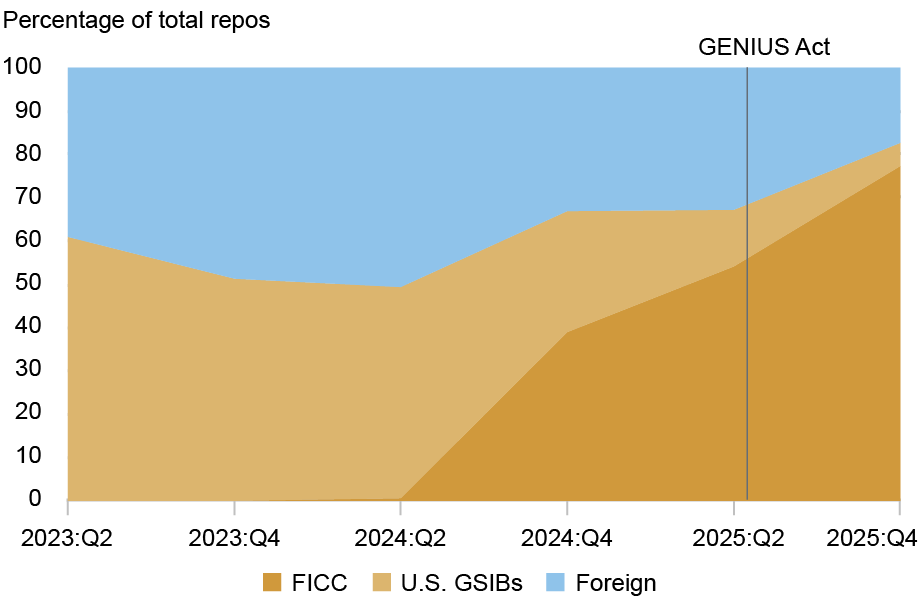
Notes: The data are at a quarterly frequency. “FICC”: Fixed Income Clearing Corporation.
Examining the CRF’s repo counterparty composition more closely, we observe a rapid shift starting in late 2024: The share of Fixed Income Clearing Corporation (FICC)-sponsored repos, whose ultimate counterparties are generally entities with a net demand for funding, such as hedge funds, grew rapidly and reached 77 percent by 2025:Q4 (see the chart above).
Next, we turn to USDC’s reserve assets held outside of the CRF, which have averaged 12 percent of total reserves since the start of 2023. How has the composition of these non-CRF reserves evolved since SVB’s failure? The chart below depicts the fraction of USDC’s reserves held as bank deposits. USDC’s bank deposits rose briefly after SVB’s failure but have since remained below the levels that prevailed before SVB’s failure.
Also, the types of banks holding USDC’s cash changed markedly, shifting from a combination of Global Systemically Important Banks (GSIBs) and non-GSIBs (including SVB and Signature Bank) in February 2023 to predominantly GSIBs by April 2023—with Circle reporting “in excess of 90% of cash” held at GSIBs. In other words, after SVB’s collapse, USDC’s bank deposits became, and have remained, concentrated in GSIBs.
Fraction of USDC’s Reserves Held at Banks
Percentage of USDC’s assets
Summing Up
Following SVB’s failure in March 2023, the composition of USDC’s primary reserve asset, held in an MMF, changed notably: the average maturity of its reserve assets declined significantly; its repo holdings surged and became concentrated in FICC in recent years. In addition, its direct deposits with banks shifted from a combination of GSIBs and non-GSIBs to GSIBs. Overall, the SVB event triggered a change in the type of risk held by one of the largest stablecoin issuers, away from interest-rate risk and toward counterparty risk. These changes highlight the growing interconnectedness between traditional finance and new, emerging financial technologies.

Kenechukwu Anadu is a vice president of the Federal Reserve Bank of Boston’s Supervision, Regulation, and Credit Department.

Pablo Azar is a financial research economist in the Federal Reserve Bank of New York’s Research and Statistics Group.
Sean Baker is a risk analyst in the Federal Reserve Bank of Boston’s Supervision, Regulation, and Credit Department.

Marco Cipriani is head of Money and Payments Studies in the Federal Reserve Bank of New York’s Research and Statistics Group.

Thomas M. Eisenbach is a financial research advisor in the Federal Reserve Bank of New York’s Research and Statistics Group.
Mattia Landoni is an associate professor of finance at China Europe International Business School (CEIBS).

Gabriele La Spada is a financial research advisor in the Federal Reserve Bank of New York’s Research and Statistics Group.
Marco Macchiavelli is an assistant professor of Finance at the University of Massachusetts, Amherst.

J. Christina Wang is a principal economist and policy advisor in the macroeconomic/financial markets section of the Federal Reserve Bank of Boston.
How to cite this post:
Kenechukwu Anadu, Pablo D. Azar, Sean Baker, Marco Cipriani, Thomas M. Eisenbach, Mattia Landoni, Gabriele La Spada, Marco Macchiavelli, and J. Christina Wang, “Stablecoins and (Non)Crypto Shocks: A 2026 Update,” Federal Reserve Bank of New York Liberty Street Economics, July 31, 2026, https://doi.org/10.59576/lse.20260731
BibTeX: View |


Disclaimer
The views expressed in this post are those of the author(s) and do not necessarily reflect the position of the Federal Reserve Bank of New York or the Federal Reserve System. Any errors or omissions are the responsibility of the author(s).
 RSS Feed
 Follow Liberty Street Economics
