










It is well known that monetary policy affects firms’ investment decisions. But which firms are the most responsive to changes in interest rates? And does this responsiveness vary over time? The literature has given diverse answers to this question, focusing on characteristics such as firm size, age, and financial position, and mostly studying these traits in isolation. In this post based on a recent Staff Report, we explore how investment responsiveness to monetary policy changes across firms and over time. We find that investment by most firms in most time periods responds little to monetary policy. For some firms in some periods, however, investment is very responsive to changes in interest rates. While these instances of strong sensitivity correlate with several firm traits, there is substantial variation that cannot easily be linked to specific characteristics of firms. Our findings therefore underscore the importance of considering the entire distribution of investment responses rather than focusing on the average effect.
How Firms’ Investment Responds to Changes in Monetary Policy
Our analysis revisits a burgeoning literature that estimates how firm-level investment responds to monetary policy surprises. In particular, we build on influential work by Ottonello and Winberry (2020). Monetary policy surprises are measured as changes in the federal funds rate implied by federal funds futures in a narrow window around monetary policy announcements. Investment is the growth rate in the capital stock measured at a quarterly frequency for each publicly listed firm in Compustat. The literature has typically studied heterogeneity in investment responses by interacting monetary surprises in a regression framework with a chosen firm characteristic, such as size, age, or a particular financial variable.
We follow a different approach. Instead of selecting a given possible driver of heterogeneity ex ante, we seek to characterize the entire unconditional distribution of responses of investment to monetary policy (which we abbreviate as RIMP). Importantly, this approach is agnostic to what drives the RIMP, although we go on to explore the relative importance of several drivers after estimating the RIMP. In practice, we estimate a clustering regression framework that optimally groups each firm in each time period as a high or low responder based on how its investment responds to monetary policy. Details of the procedure can be found in our Staff Report.
Our estimates deliver a RIMP distribution, which we plot in the chart below. In the vast majority of quarters and for most firms, investment responds little to changes in monetary policy. This sensitivity, however, is not zero. Indeed, all firms still cut investment when interest rates increase, as witnessed by the negative values in the horizontal axis of the chart. In a few instances, investment drops significantly in the face of an interest rate hike. For about 5 percent of all firms and quarters, a monetary shock that raises the federal funds rate by 1 percentage point induces a 4 percentage point drop in the growth rate of capital.
Most Firms in Most Time Periods Respond Little to Monetary Policy Changes; Some Respond Strongly
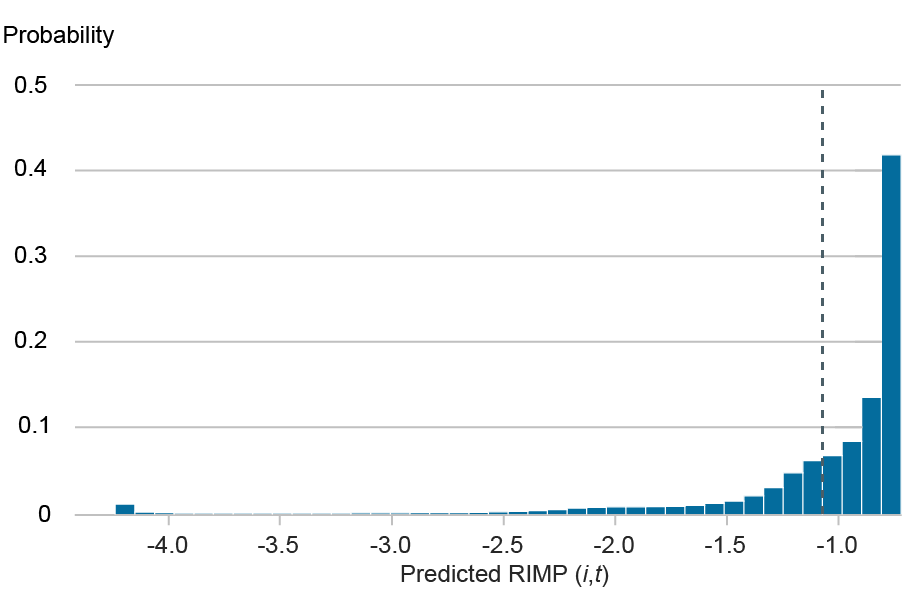
Notes: The chart plots the predicted response of investment to monetary policy (RIMP) at the firm-quarter level. The vertical dashed line marks the homogeneous RIMP.
Which Firms Respond the Most?
Having estimated the RIMP distribution, we can dig deeper into what makes a firm’s, or a given quarter’s, investment very responsive to monetary shocks. We decompose the variance of responses into three components: (permanent) firm variation, aggregate time variation, and firm-specific time variation. As we show in the chart below, very little of the overall variation in the RIMP is common to all firms. A larger, but still limited, share is explained by permanent differences across firms. It follows that most of the variation in the RIMP is within firms over time. This means that a specific firm’s investment can respond substantially to a monetary shock in a given quarter, but that same firm can be relatively unresponsive for several quarters thereafter.
Most of the Variation in Firms’ Sensitivity to Interest-Rate Surprises Is Within Firms over Time
Share of RIMP variation (percent)
Note: The chart decomposes the response of investment to monetary policy (RIMP) into permanent differences across firms, aggregate variation over time, and within-firm variation over time.
Our approach also allows us to investigate which firm characteristics are the most important determinants of the investment responsiveness to monetary shocks. For instance, Gertler and Gilchrist (1994) find that small firms are more responsive, whereas Cloyne et al. (2024) point at young firms. In the chart below, we project our estimated RIMP on each of these two characteristics and confirm both findings. In fact, we also find that the characteristics interact, as we show in the paper: small and young firms have the most negative RIMP (in other words, they cut investment the most when faced with a monetary tightening).
Small Firms and Young Firms Cut Investment the Most When Faced with an Interest Rate Hike
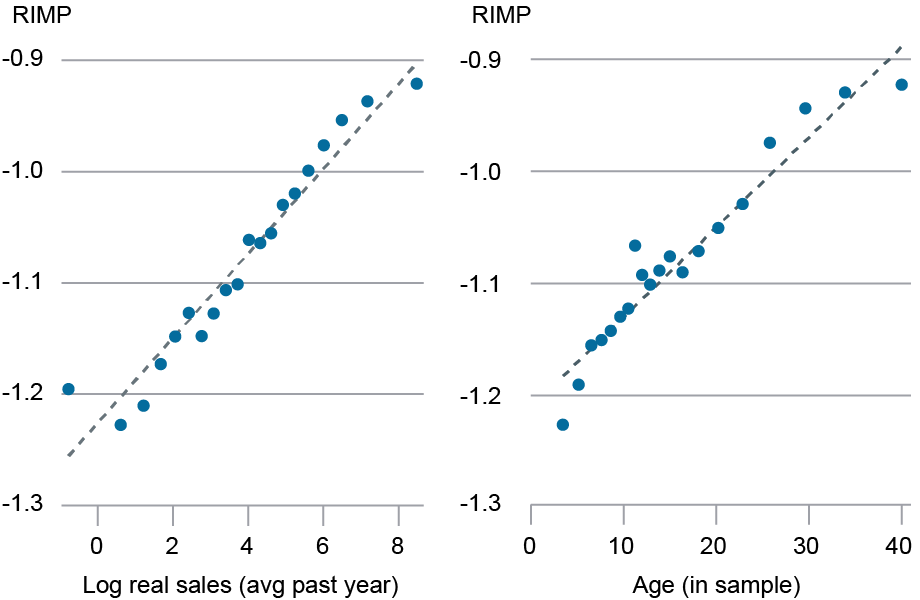
Notes: The chart presents binscatter plots in which the predicted response of investment to monetary policy (RIMP) is plotted against size (left panel, the log of average real sales over the past four quarters) and age (right panel, defined as years in the sample). Dashed lines indicate fitted linear regressions.
In the Staff Report, we explore several other drivers studied in the literature. For instance, we find that firms with shorter debt maturity are more sensitive to monetary policy. We also highlight other drivers that might indicate the importance of behavioral mechanisms. For example, perceptions of discount rates and the cost of capital are correlated with the RIMP. Moreover, firms that report being more optimistic cut investment less in response to an interest rate hike.
Importantly, all of these characteristics may affect investment responsiveness jointly and will likely interact. Our approach allows us to study this multidimensionality directly. While we find that several characteristics predict investment responses, much of the overall variation in the RIMP remains unexplained.
Conclusion
We have provided new empirical evidence on how investment responds to changes in monetary policy. While all firms cut investment when faced with an interest rate hike, most adjust little whereas a few firms respond a lot. This high sensitivity appears to be transient: a given firm is responsive to a monetary surprise in a given quarter, but then responds little thereafter. Several firm characteristics predict investment responses. For instance, small and young firms appear to be the most sensitive to monetary policy changes. Our approach allows us to study this heterogeneity in a comprehensive manner: we find that several firm drivers matter concurrently and that much of the investment responsiveness is driven by unobservable factors.
Thomas Drechsel is an associate research professor in the Economics Department at Johns Hopkins University.
Daniel Lewis is an associate professor in the Department of Economics at University College London.1

Davide Melcangi is an economic research advisor in the Federal Reserve Bank of New York’s Research and Statistics Group.
Laura Pilossoph is an associate professor of economics at Duke University.
1 Disclosure statement for Daniel Lewis: During the past three years, I received consultancy fees exceeding the disclosure threshold under the AEA Disclosure Policy from Banque de France, a potentially interested party with respect to the subject matter of this article. The consultancy relationship did not affect the design, analysis, interpretation, or reporting of the research. The interested party had no right to review this research.
How to cite this post:
Thomas Drechsel, Daniel Lewis, Davide Melcangi, and Laura Pilossoph, “Firm Heterogeneity and the Response of Investment to Monetary Policy,” Federal Reserve Bank of New York Liberty Street Economics, October 7, 2026, https://doi.org/10.59576/lse.20261007
BibTeX: View |



Disclaimer
The views expressed in this post are those of the author(s) and do not necessarily reflect the position of the Federal Reserve Bank of New York or the Federal Reserve System. Any errors or omissions are the responsibility of the author(s).
 You can follow this conversation by subscribing to the comment feed for this post.
 RSS Feed
 Follow Liberty Street Economics
