


116 posts on "Credit"
June 17, 2024
Nonbanks Are Growing but Their Growth Is Heavily Supported by Banks

Traditional approaches to financial sector regulation view banks and nonbank financial institutions (NBFIs) as substitutes, one inside and the other outside the perimeter of prudential regulation, with the growth of one implying the shrinking of the other. In this post, we argue instead that banks and NBFIs are better described as intimately interconnected, with NBFIs being especially dependent on banks both for term loans and lines of credit.
May 21, 2024
The Changing Landscape of Corporate Credit

Firms’ access to credit is a crucial determinant of their investment, employment, and overall growth decisions. While we usually think of their ability to borrow as determined by aggregate credit conditions, in reality firms have a number of markets where they can borrow, and conditions can vary across those markets. In this post, we investigate how the composition of debt instruments on U.S. firms’ balance sheets has evolved over the last twenty years.
May 14, 2024
Delinquency Is Increasingly in the Cards for Maxed‑Out Borrowers
Editor’s note: Since this post was first published, the aggregate credit card utilization rate cited in the second paragraph has been corrected. (May 14, 12:05pm). The percentage of Gen Z credit card users who are “maxed-out” has been corrected in the text and now matches the table. (May 15, 2024, 4:00 pm)

This morning, the New York Fed’s Center for Microeconomic Data released the Quarterly Report on Household Debt and Credit for the first quarter of 2024. Household debt balances grew by $184 billion over the previous quarter, slightly less than the moderate growth seen in the fourth quarter of 2023. Housing debt balances grew by $206 billion. Auto loans saw a $9 billion increase, continuing their steady growth since the second quarter of 2020, while balances on other non-housing debts fell. Credit card balances fell by $14 billion, which is typical for the first quarter. However, an increasing number of borrowers are behind on credit card payments. In this post, we explore the relationship between credit card delinquency and changes in credit card “utilization rates.”
April 1, 2024
Learning by Bouncing: Overdraft Experience and Salience

Overdraft credit, when banks and credit unions allow customers to spend more than their checking account holds, has many critics. One fundamental concern is whether overdrafts are salient—whether account holders know how often they overdraw and how much it costs them. To shed light on this question, we asked participants in the New York Fed’s Survey of Consumer Expectations about their experience with and knowledge of their banks’ overdraft programs. The large majority knew how often they overdrew their account and by how much. Their overdraft experience, we find, begets knowledge; of respondents who overdrew their account in the previous year, 84 percent knew the fee they were charged, roughly twice the share for other respondents. However, even experienced overdrafters were relatively unaware of other overdraft terms and practices, such as the maximum overdraft allowed or whether their financial institution processed larger transactions first.
February 14, 2024
How and Why Do Consumers Use “Buy Now, Pay Later”?
In a previous post, we highlighted that financially fragile households are disproportionately likely to use “buy now, pay later” (BNPL) payment plans. In this post, we shed further light on BNPL’s place in its users’ household finances, with a particular focus on how use varies by a household’s level of financial fragility. Our results reveal substantially different use patterns, as more-fragile households tend to use the service to make frequent, relatively small, purchases that they might have trouble affording otherwise. In contrast, financially stable households tend to not use BNPL as frequently and are more likely to emphasize that BNPL allows them to avoid paying interest on credit-finance purchases. We explore below what drives these differences and consider the implications for future BNPL use.
February 6, 2024
Auto Loan Delinquency Revs Up as Car Prices Stress Budgets

The New York Fed’s Center for Microeconomic Data released the Quarterly Report on Household Debt and Credit for the fourth quarter of 2023 this morning. Household debt balances grew by $212 billion over the last quarter. Although there was growth across most loan types, it was moderate compared to the fourth-quarter changes seen in the past few years. Mortgage balances grew by $112 billion and home equity line of credit (HELOC) balances saw an $11 billion bump as borrowers tapped home equity in lieu of refinancing first mortgages. Credit card balances, which typically see substantial increases in the fourth quarter coinciding with holiday spending, grew by $50 billion, and are now 14.5 percent higher than in the fourth quarter of 2022. Auto loan balances saw a $12 billion increase from the previous quarter, continuing the steady growth that has been in place since 2011. In this post, we revisit our analysis on credit cards and examine which groups are struggling with their auto loan payments. The Quarterly Report and this analysis are based on the New York Fed Consumer Credit Panel (CCP), a panel which is drawn from Equifax credit reports.
November 13, 2023
How Do Banks Lend in Inaccurate Flood Zones in the Fed’s Second District?
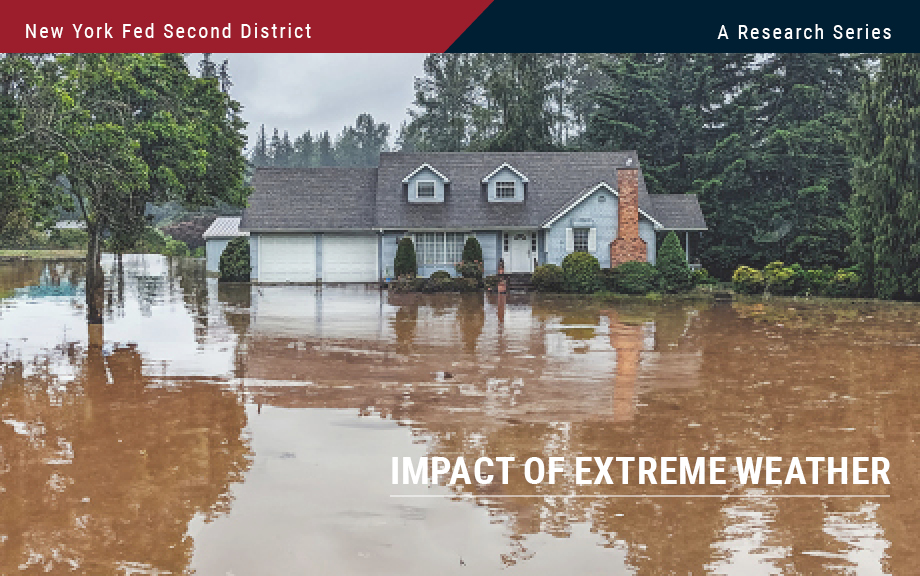
In our previous post, we identified the degree to which flood maps in the Federal Reserve’s Second District are inaccurate. In this post, we use our data on the accuracy of flood maps to examine how banks lend in “inaccurately mapped” areas, again focusing on the Second District in particular. We find that banks are seemingly aware of poor-quality flood maps and are generally less likely to lend in such regions, thereby demonstrating a degree of flood risk management or risk aversion. This propensity to avoid lending in inaccurately mapped areas can be seen in jumbo as well as non-jumbo loans, once we account for a series of confounding effects. The results for the Second District largely mirror those for the rest of the nation, with inaccuracies leading to similar reductions in lending, especially among non-jumbo loans.
June 1, 2023
What Drove Racial Disparities in the Paycheck Protection Program?

Numerous studies of the Paycheck Protection Program (PPP), which provided loans to small businesses during the COVID-19 pandemic, have documented racial disparities in the program. Because publicly available PPP data only include information on approved loans, prior work has largely been unable to assess whether these disparities were driven by borrower application behavior or by lender approval decisions. In this post, which is based on a related Staff Report and NBER working paper, we use the Federal Reserve’s 2020 Small Business Credit Survey to examine PPP application behavior and approval decisions and to study the strengths and limitations of fintech lenders in enhancing access to credit for Black-owned businesses.
May 31, 2023
Do Economic Crises in Europe Affect the U.S.? Some Lessons from the Past Three Decades

In this post we summarize the main results of our contribution to a recent e-book, “The Making of the European Monetary Union: 30 years since the ERM crisis,” on the economic and financial crises in Europe since 1992-93, and focus on the spillovers of those crises onto the United States and the global economy. We find that the answer to the question in the title of this post is a (moderate) yes.
Posted at 7:00 am in Credit, Crisis, DSGE, Euro Area, Exchange Rates, Exports, International Economics, Macroeconomics | Permalink
May 22, 2023
Financial Vulnerability and Macroeconomic Fragility

What is the effect of a hike in interest rates on the economy? Building on recent research, we argue in this post that the answer to this question very much depends on how vulnerable the financial system is. We measure financial vulnerability using a novel concept—the financial stability interest rate r** (or “r-double-star”)—and show that, empirically, the economy is more sensitive to shocks when the gap between r** and current real rates is small or negative.
Posted at 7:00 am in Banks, Credit, Financial Intermediation, Systemic Risk | Permalink | Comments (1)
 RSS Feed
 Follow Liberty Street Economics