A Turning Point in Wage Growth?

The surge in wage growth experienced by the U.S. economy over the past two years is showing some tentative signs of moderation. In this post, we take a closer look at the underlying data by estimating a model designed to isolate the persistent component—or trend—of wage growth. Our central finding is that this trend may have peaked in early 2022, having experienced an earlier rise and subsequent moderation that were broad-based across sectors. We also find that wage growth seems to be moderating more slowly than the trend in services inflation.
What Is “Outlook‑at‑Risk?”
Editor’s note: Since this post was first published, the y-axis label in the last chart has been corrected. February 15, 9:30 a.m.

The Federal Open Market Committee (FOMC) has increased the target range for the federal funds rate by 4.50 percentage points since March 16, 2022. In tightening the stance of monetary policy, the FOMC balances the risk of inflation remaining persistently high if the economy continues to run “hot” against the risk of unemployment rising as the economy cools. In this post, we review a quantitative approach to measuring the evolution of risks to real GDP growth, the unemployment rate, and inflation that is inspired by our previous work on “Vulnerable Growth.” We find that, in February, downside risks to real GDP growth and upside risks to unemployment moderated slightly, and upside risks to inflation continued to decline.
Is There a Bitcoin–Macro Disconnect?

Cryptocurrencies’ market capitalization has grown rapidly in recent years. This blog post analyzes the role of macro factors as possible drivers of cryptocurrency prices. We take a high-frequency perspective, and we focus on Bitcoin since its market capitalization dwarfs that of all other cryptocurrencies combined. The key finding is that, unlike other asset classes, Bitcoin has not responded significantly to U.S. macro and monetary policy news. This disconnect is puzzling, as unexpected changes in discount rates should, in principle, affect the price of Bitcoin.
The Layers of Inflation Persistence

In a recent post, we introduced the Multivariate Core Trend (MCT), a measure of inflation persistence in the core sectors of the personal consumption expenditure (PCE) price index. With data up to February 2022, we used the MCT to interpret the nature of post-pandemic price spikes, arguing that inflation dynamics were dominated by a persistent component largely common across sectors, which we estimated at around 5 percent. Indeed, over the year, inflation proved to be persistent and broad based, and core PCE inflation is likely to end 2022 near 5 percent. So, what is the MCT telling us today? In this post, we extend our analysis to data through November 2022 and detect signs of a decline in the persistent component of inflation in recent data. We then dissect the layers of inflation persistence to fully understand that decline.
Highlights from the Fifth Bi‑annual Global Research Forum on International Macroeconomics and Finance

The COVID-19 pandemic, geopolitical tensions, and distinct economic conditions bring challenges to economies worldwide. These key themes provided a backdrop for the fifth bi-annual Global Research Forum on International Macroeconomics and Finance, organized by the European Central Bank (ECB), the Federal Reserve Board, and Federal Reserve Bank of New York in New York in November. The papers and discussions framed important issues related to the global economy and financial markets, and explored the implications of policies that central banks and other official sector bodies take to address geopolitical developments and conditions affecting growth, inflation, and financial stability. A distinguished panel of experts shared diverse perspectives on the drivers of and prospects for inflation from a global perspective. In this post, we discuss highlights of the conference. The event page includes links to videos for each session.
The New York Fed DSGE Model Forecast—December 2022

This post presents an update of the economic forecasts generated by the Federal Reserve Bank of New York’s dynamic stochastic general equilibrium (DSGE) model. We describe very briefly our forecast and its change since September 2022.
Computer Saturation and the Productivity Slowdown

One of the current puzzles in economics is the recent worldwide slowdown in productivity, compared to the late 1990s and early 2000s. This productivity loss is economically large: if productivity growth had stayed at the same level as in 1995-2004, American GDP would have increased by trillions of dollars. In this post, I discuss a new paper that links this productivity slowdown to saturation in electronics adoption across most industries. I show that most of the productivity growth from electronic miniaturization is concentrated between 1985 and 2005.
The New York Fed DSGE Model Forecast—September 2022

This post presents an update of the economic forecasts generated by the Federal Reserve Bank of New York’s dynamic stochastic general equilibrium (DSGE) model. We describe very briefly our forecast and its change since June 2022.
How Much Did Supply Constraints Boost U.S. Inflation?

What factors are behind the recent inflation surge has been a huge topic of debate amongst academics and policymakers. We know that pandemic-related supply constraints such as labor shortages and supply chain bottlenecks have been key factors pushing inflation higher. These bottlenecks started with the pandemic (lockdowns, sick workers) and were made worse by the push arising from increased demand caused by very expansionary fiscal and monetary policy. Our analysis of the relative importance of supply-side versus demand-side factors finds 60 percent of U.S. inflation over the 2019-21 period was due to the jump in demand for goods while 40 percent owed to supply-side issues that magnified the impact of this higher demand.
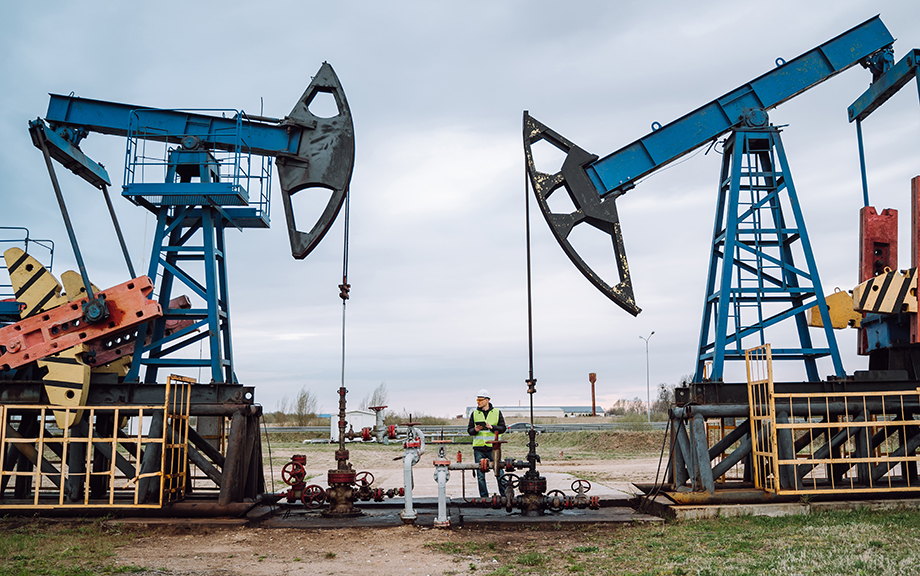
The Disconnect between Productivity and Profits in U.S. Oil and Gas Extraction

U.S. oil and gas production boomed during the years leading up to the pandemic. From 2011 to 2019, oil production more than doubled and dry natural gas production rose by more than half. Remarkably, these gains occurred despite lackluster investment spending and hiring. Instead, higher production came largely from productivity gains, via wider adoption of fracking technologies. More recently, production recovered sluggishly from the pandemic downturn despite a quick recovery in prices. Our analysis in this post suggests that slower productivity growth and investors’ demand for higher returns have made U.S. firms willing to boost output only at a higher threshold oil price.


 RSS Feed
 Follow Liberty Street Economics