Supply Chain Disruptions Have Eased, But Remain a Concern

Supply chain disruptions became a major headache for businesses in the aftermath of the pandemic. Indeed, in October 2021, nearly all firms in our regional business surveys reported at least some difficulty obtaining the supplies they needed. These supply chain disruptions were a key contributor to the surge in inflation that occurred as the economy recovered from the pandemic recession. In this post, we present new measures of supply availability from our Business Leaders Survey and Empire State Manufacturing Survey that closely track the New York Fed’s Global Supply Chain Pressure Index (GSCPI). We will begin publishing these data on a monthly basis starting in June. These indexes indicate that supply availability had generally been improving since early 2023, but over the past couple of months, improvement has stalled. This trend is concerning since our May Supplemental Survey indicates that between a third and a half of businesses in the region are experiencing difficulties obtaining supplies, and many are reducing operations and raising prices to compensate, though to a lesser extent than a few years ago.
Many Places Still Have Not Recovered from the Pandemic Recession

More than four years have passed since the onset of the pandemic, which resulted in one of the sharpest and deepest economic downturns in U.S. history. While the nation as a whole has recovered the jobs that were lost during the pandemic recession, many places have not. Indeed, job shortfalls remain in more than a quarter of the country’s metro areas, including many in the New York-Northern New Jersey region. In fact, while employment is well above pre-pandemic levels in Northern New Jersey, jobs have only recently recovered in and around New York City, and most of upstate New York—like much of the Rust Belt—still has not fully recovered and has some of the largest job shortfalls in the country.
Businesses See Inflationary Pressures Moderating

Shortly after the recovery from the pandemic recession began, the U.S. economy entered a period of high inflation as surging demand, severe supply disruptions, and worker shortages combined to create large imbalances and inflationary pressures in the economy. More recently, however, inflationary pressures have been moderating. Indeed, the inflation rate as measured by the consumer price index (CPI) has come down from its recent peak of 9.1 percent in the summer of 2022 to 3.1 percent at the start of 2024. Have inflationary pressures also moderated for local businesses in the New York–Northern New Jersey region? The New York Fed’s February business surveys asked firms about increases in their costs and prices. Results indicate that the pace of increase in costs, wages, and prices have all slowed considerably over the past year. Moreover, firms in the region expect cost and price increases, as well as the overall inflation rate, to moderate further in the year ahead.
Flood‑Prone Basement Housing in New York City and the Impact on Low‑ and Moderate‑Income Renters

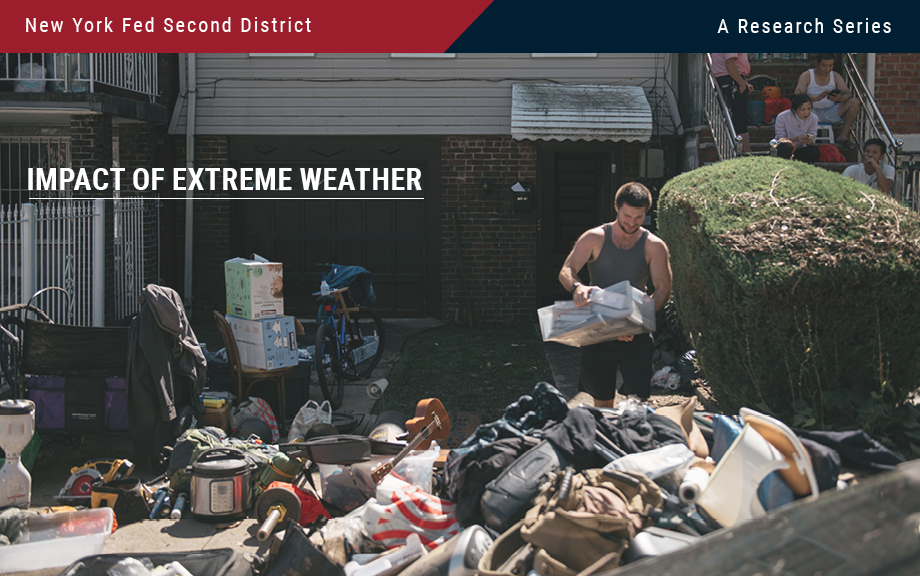
Hurricane Ida, which struck New York in early September 2021, exposed the region’s vulnerability to extreme rainfall and inland flooding. The storm created massive damage to the housing stock, particularly low-lying units. This post measures the storm’s impact on basement housing stock and, following the focus on more-at-risk populations from the two previous entries in this series, analyzes the attendant impact on low-income and immigrant populations. We find that basements in select census tracts are at high risk of flooding, affecting an estimated 10 percent of low-income and immigrant New Yorkers.
Small Business Recovery after Natural Disasters in the Fed’s Second District

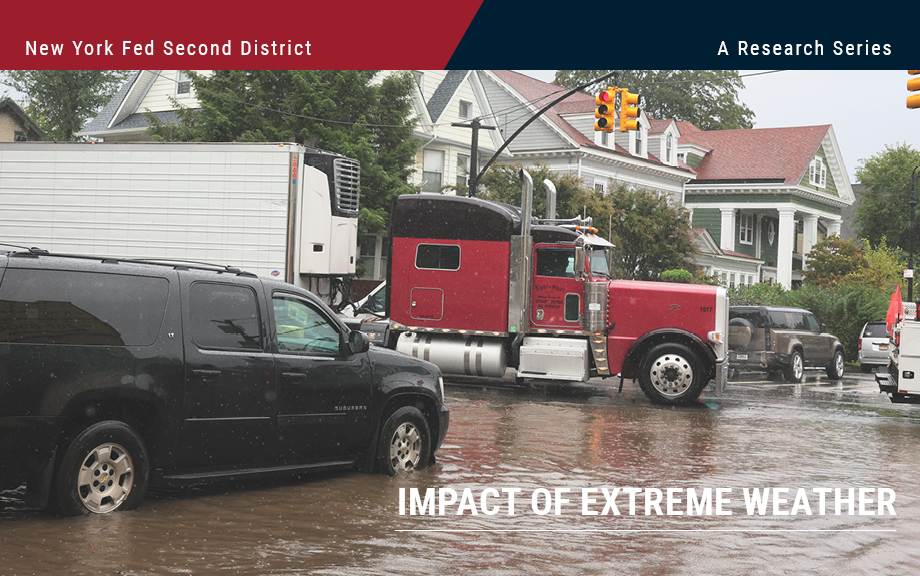
A previous Liberty Street Economics post found that minority-owned small businesses in the Federal Reserve’s Second District have been particularly vulnerable to natural disasters. Here we focus on the aftermath of disasters (such as hurricanes, floods, wildfires, droughts, and winter storms) and examine disparities in the ability of these firms to reopen their businesses and access disaster relief. Our results indicate that while white- and minority-owned firms remain closed for similar durations, the latter are more reliant on external funding from government and private sources to cope with disaster losses.
How Do Natural Disasters Affect Small Business Owners in the Fed’s Second District?

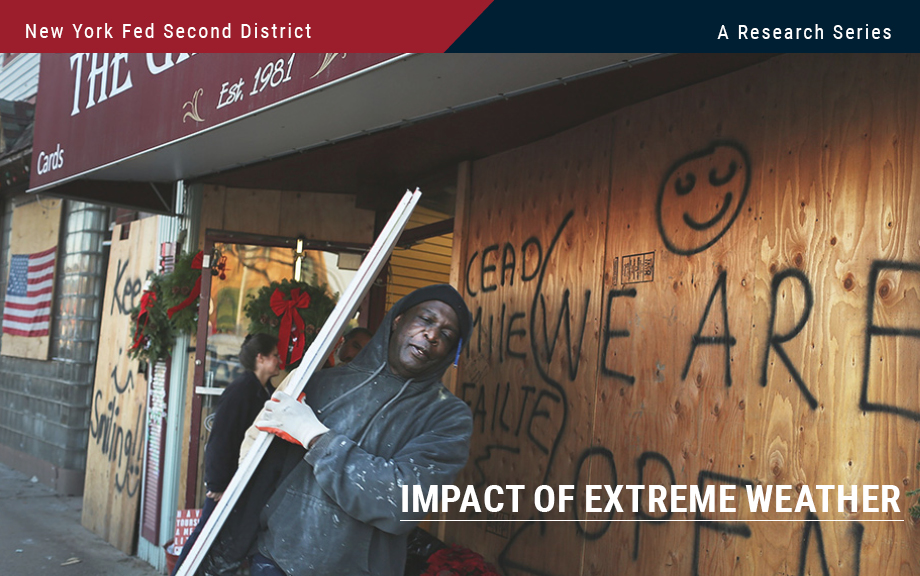
In this post, we follow up on the previous Liberty Street Economics post in this series by studying other impacts of extreme weather on the real sector. Data from the Federal Reserve’s Small Business Credit Survey (SBCS) shed light on how small businesses in the Second District are impacted by natural disasters (such as hurricanes, floods, wildfires, droughts, and winter storms). Among our findings are that increasing shares of small business firms in the region sustain losses from natural disasters, with minority-owned firms suffering losses at a disproportionately higher rate than white-owned firms. For many minority-owned firms, these losses make up a larger portion of their total revenues. In a companion post, we will explore the post-disaster recovery of small firms in the Second District: how long do they remain closed and what are their sources of disaster relief?
Potential Flood Map Inaccuracies in the Fed’s Second District

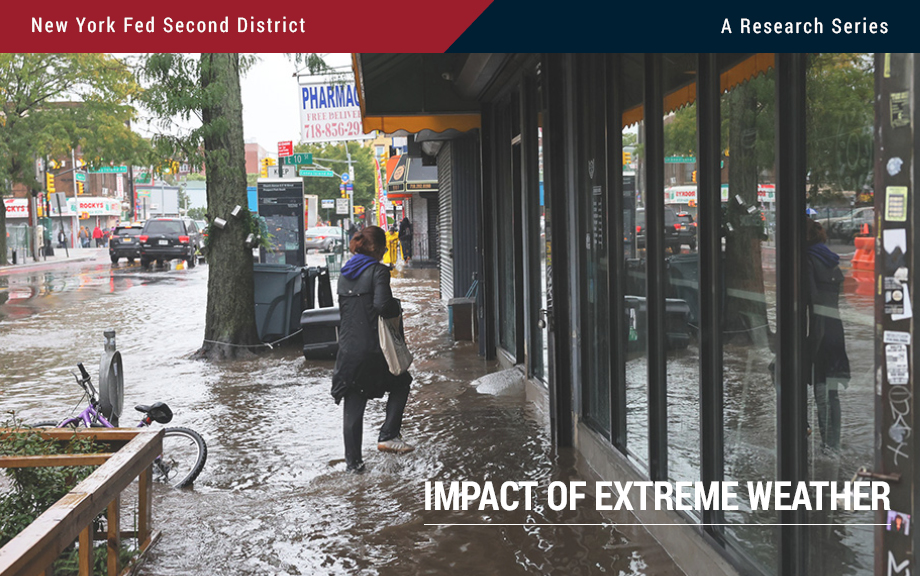
The National Flood Insurance Program (NFIP) flood maps, which designate areas at risk of flooding, are updated periodically through the Federal Emergency Management Agency (FEMA) and community efforts. Even so, many maps are several years old. As the previous two posts in the Extreme Weather series show, climate-related risks vary geographically. It is therefore important to produce accurate maps of such risks, like flooding. In this post we use detailed data on the flood risk faced by individual dwellings as well as digitized FEMA flood maps to tease out the degree to which flood maps in the Second District are inaccurate. Since inaccurate maps may leave households or banks exposed to the risk of uninsured flood damage, understanding map inaccuracies is key. We show that, when aggregated to the census tract level, a large number of maps do not fully capture flood risk. However, we are also able to show that updates do in fact improve map quality.


 RSS Feed
 Follow Liberty Street Economics