Highlights from the Fifth Bi‑annual Global Research Forum on International Macroeconomics and Finance

The COVID-19 pandemic, geopolitical tensions, and distinct economic conditions bring challenges to economies worldwide. These key themes provided a backdrop for the fifth bi-annual Global Research Forum on International Macroeconomics and Finance, organized by the European Central Bank (ECB), the Federal Reserve Board, and Federal Reserve Bank of New York in New York in November. The papers and discussions framed important issues related to the global economy and financial markets, and explored the implications of policies that central banks and other official sector bodies take to address geopolitical developments and conditions affecting growth, inflation, and financial stability. A distinguished panel of experts shared diverse perspectives on the drivers of and prospects for inflation from a global perspective. In this post, we discuss highlights of the conference. The event page includes links to videos for each session.
Banking System Vulnerability: 2022 Update

To assess the vulnerability of the U.S. financial system, it is important to monitor leverage and funding risks—both individually and in tandem. In this post, we provide an update of four analytical models aimed at capturing different aspects of banking system vulnerability with data through 2022:Q2, assessing how these vulnerabilities have changed since last year. The four models were introduced in a Liberty Street Economics post in 2018 and have been updated annually since then.
Long COVID Appears to Have Led to a Surge of the Disabled in the Workplace
Although most of those infected with COVID-19 have recovered relatively quickly, a substantial share has not, and remains symptomatic months or even years later, in what is commonly referred to as long COVID. Data on the incidence of long COVID is scarce, but recent Census Bureau data suggest that sixteen million working age Americans suffer from it. The economic costs of long COVID is estimated to be in the trillions. While many with long COVID have dropped out of the labor force because they can no longer work, many others appear to be working despite having disabilities related to the disease. Indeed, there has been an increase of around 1.7 million disabled persons in the U.S. since the pandemic began, and there are close to one million newly disabled workers. These disabled workers can benefit from workplace accommodations to help them remain productive and stay on the job, particularly as the majority deal with fatigue and brain fog, the hallmarks of long COVID.
What Have Workers Done with the Time Freed up by Commuting Less?
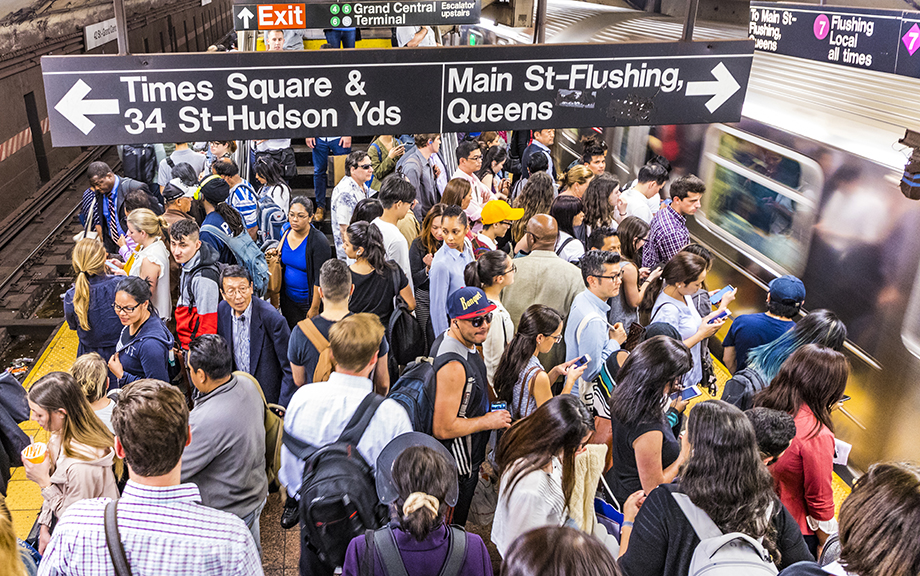
The COVID-19 pandemic has dramatically changed the way Americans spend their time. One of the most enduring shifts has occurred in the workplace, with millions of employees making the switch to work from home. Even as the pandemic has waned, more than 15 percent of full-time employees remain fully remote and an additional 30 percent work in hybrid arrangements (Barrero, Bloom, and Davis). These changes have substantially reduced time spent commuting to work; in the aggregate, Americans now spend 60 million fewer hours traveling to work each day. In this post, we investigate how people spend this saved time on other activities. Using detailed data from the American Time Use Survey (ATUS), we find that employed individuals allocate their saved commute time toward leisure activities and sleeping, while reducing overall work hours.
Eviction Expectations in the Post‑Pandemic Housing Market
Housing is the single largest element of the typical household’s budget, and data from the SCE Household Spending Survey show that this is especially true for renters. As the housing market heated up in the latter stages of the pandemic, home prices and rents both began to rise sharply. For renters, some protection from these increases was afforded by national, state, and in some cases local eviction moratoria, which greatly reduced the risk of households losing access to stable housing if they couldn’t afford their rent. Yet many of these protections have expired and additional supports will do so soon. In this post, we draw on data from our SCE Housing Survey to explore how renters perceive their housing risk and find that the answers depend to a large degree on their current and past experiences of the housing market.
Three Key Facts from the Center for Microeconomic Data’s 2022 Student Loan Update

Today, researchers from the Center for Microeconomic Data released the 2022 Student Loan Update, which contains statistics summarizing who holds student loans along with characteristics of these balances. To compute these statistics, we use the New York Fed Consumer Credit Panel (CCP), a nationally representative 5 percent sample of all U.S. adults with an Equifax credit report. For this update, we focus on individuals with a student loan on their credit report. The update is linked here and shared in the student debt section of the Center for Microeconomic Data’s website. In this post, we highlight three facts from the current student loan landscape.
Pandemic Wage Pressures

The recovery since the onset of the pandemic has been characterized by a tight labor market and rising nominal wage growth. In this post, we look at labor market conditions from a more granular, sectoral point of view focusing on data covering the nine major industries. This breakdown is motivated by the exceptionality of the pandemic episode, the way it has asymmetrically affected sectors of the economy, and by the possibility of exploiting sectoral heterogeneities to understand the drivers of recent labor market dynamics. We document that wage pressures are highest in the sectors with the largest employment shortfall relative to their pre-pandemic trend path, but that other factors explain most of the wage growth differentials. We suggest that one key factor is the extent of physical contact that has had to be compensated for by offering higher wages. One implication of our analysis is that, as COVID-related factors recede, sectoral imbalances could be restored from the supply side as employment recovers back toward the pre-pandemic trend.
Does China’s Zero Covid Strategy Mean Zero Economic Growth?

The Chinese government has followed a “zero covid strategy” (ZCS) ever since the world’s first COVID-19 lockdowns ended in China around late March and early April of 2020. While this strategy has been effective at maintaining low infection levels and robust manufacturing and export activity, its viability is being severely strained by the spread of increasingly infectious coronavirus variants. As a result, there now appears to be a fundamental incompatibility between the ZCS and the government’s economic growth objectives.
What Do Consumers Think Will Happen to Inflation?

This post provides an update on two earlier blog posts (here and here) in which we discuss how consumers’ views about future inflation have evolved in a continually changing economic environment. Using data from the New York Fed’s Survey of Consumer Expectations (SCE), we show that while short-term inflation expectations have continued to trend upward, medium-term inflation expectations appear to have reached a plateau over the past few months, and longer-term inflation expectations have remained remarkably stable. Not surprisingly given recent movements in consumer prices, we find that most respondents agree that inflation will remain high over the next year. In contrast, and somewhat surprisingly, there is a divergence in consumers’ medium-term inflation expectations, in the sense that we observe a simultaneous increase in both the share of respondents who expect high inflation and the share of respondents who expect low inflation (and even deflation) three years from now. Finally, we show that individual consumers have become more uncertain about what inflation will be in the near future. However, in contrast to the pre-pandemic period, they tend to express less uncertainty about inflation further in the future.


 RSS Feed
 Follow Liberty Street Economics