











This post presents an update of the economic forecasts generated by the Federal Reserve Bank of New York’s dynamic stochastic general equilibrium (DSGE) model. We describe very briefly our forecast and its change since June 2026. The New York Fed DSGE model expects similar growth, and slightly more persistent inflation, compared to its forecasts in June. r* forecasts are slightly lower for 2026 but higher for the remainder of the forecast horizon.
Note: The DSGE model forecast is not an official New York Fed forecast, but only an input to the Research staff’s overall forecasting process. For more information about the model and variables discussed here, see our DSGE model Q & A.
The forecasts are obtained using data released through 2026:Q2, augmented for 2026:Q3 with the median forecasts for real GDP growth and core PCE inflation, and short-run inflation expectations from the August release of the Philadelphia Fed Survey of Professional Forecasters (SPF), expectations of the future level of the federal funds rate from the July release of the New York Fed Survey of Market Expectations, as well as the yields on 10-year Treasury securities and Baa-rated corporate bonds.
The model remains pessimistic on growth, and keeps being surprised when the economy turns out to be stronger than it expected. In particular, the SPF projects GDP growth in 2026:Q3 to be more than 1 percent higher in annualized terms than the DSGE model expected in June. The model attributes this likely forecast miss (under the assumption that the SPF projection will be correct) to more buoyant financial conditions than expected and to the positive growth effect of the AI-related boom in investment, as captured by MEI (marginal efficiency of investment) shocks. The model’s growth forecasts for 2026 remained at 1.2 percent, as in June. The DSGE forecasts remain rather pessimistic on growth for the remainder of the forecast horizon, in part because the model expects monetary policy to be more restrictive than it did in June, and in part because it revised downward its expectations for total factor productivity (TFP) growth. The GDP growth projections for 2027, 2028, and 2029 are 0.1, 0.5, and 1.2 percent, respectively, compared to 0.2, 0.7, and 1.5 in June.
For core inflation, the SPF projections for 2026:Q3 were broadly in line with the DSGE forecast in June. Still, the model now expects inflation to revert toward the FOMC’s long-run goal of 2 percent more slowly than it did in June, in part because lower TFP growth results in higher inflation. The projections for 2026, 2027, 2028, and 2029 are 3.3, 2.1, 1.8, and 1.8 percent, compared to 3.1, 1.8, 1.6, and 1.7 percent in June, respectively.
The model’s prediction for the short-run real natural rate of interest (r*) is 1.9 percent annualized for 2026, down from 2.0 percent in June. The r* forecasts are slightly higher than in June for the remainder of the forecast horizon, however (1.8, 1.4, and 1.2 percent for 2027, 2028, and 2029, compared to 1.7, 1.3, and 1.1 percent in June, respectively).
Forecast Comparison
| Forecast Period | 2026 | 2027 | 2028 | 2029 | ||||
|---|---|---|---|---|---|---|---|---|
| Date of Forecast | Sep 26 | Jun 26 | Sep 26 | Jun 26 | Sep 26 | Jun 26 | Sep 26 | Jun 26 |
| GDP growth (Q4/Q4) | 1.2 (-0.8, 3.1) | 1.2 (-2.2, 4.5) | 0.1 (-5.2, 5.5) | 0.2 (-5.0, 5.2) | 0.5 (-4.9, 5.9) | 0.7 (-4.8, 6.0) | 1.2 (-4.4, 6.8) | 1.5 (-4.1, 6.9) |
| Core PCE inflation (Q4/Q4) | 3.3 (3.0, 3.7) | 3.1 (2.5, 3.7) | 2.1 (1.0, 3.2) | 1.8 (0.7, 3.0) | 1.8 (0.6, 3.0) | 1.6 (0.4, 2.9) | 1.8 (0.5, 3.1) | 1.7 (0.4, 3.0) |
| Real natural rate of interest (Q4) | 1.9 (0.7, 3.1) | 2.0 (0.7, 3.3) | 1.8 (0.4, 3.3) | 1.7 (0.2, 3.1) | 1.4 (-0.1, 3.0) | 1.3 (-0.3, 2.9) | 1.2 (-0.5, 2.8) | 1.1 (-0.5, 2.8) |
Notes: This table lists the forecasts of output growth, core PCE inflation, and the real natural rate of interest from the September 2026 and June 2026 forecasts. The numbers outside parentheses are the mean forecasts, and the numbers in parentheses are the 68 percent bands.
Forecasts of Output Growth
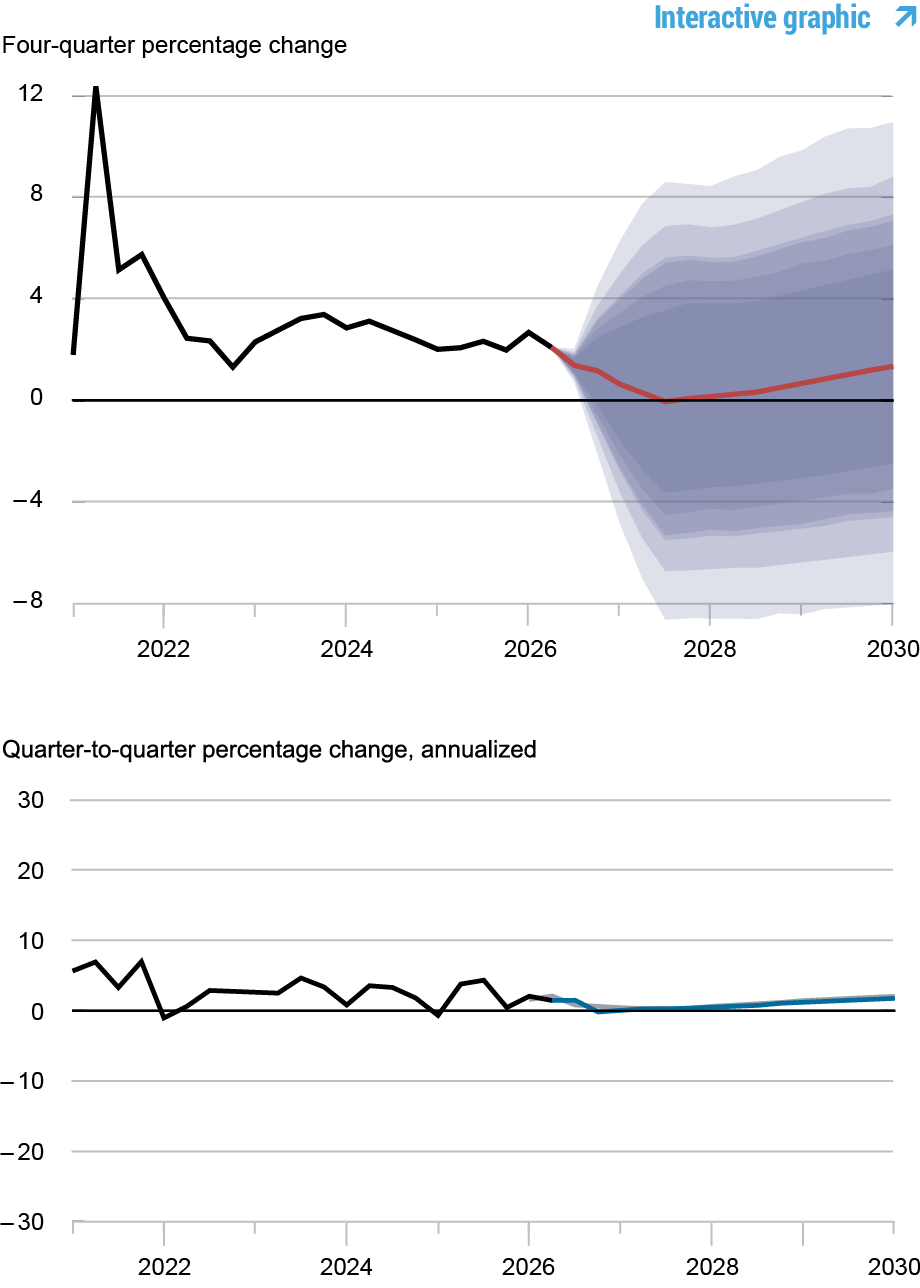
Notes: These two panels depict output growth. In the top panel, the black line indicates actual data and the red line shows the model forecasts. The shaded areas mark the uncertainty associated with our forecasts at 50, 60, 70, 80, and 90 percent probability intervals. In the bottom panel, the blue line shows the current forecast (quarter-to-quarter, annualized), and the gray line shows the June 2026 forecast.
Forecasts of Inflation
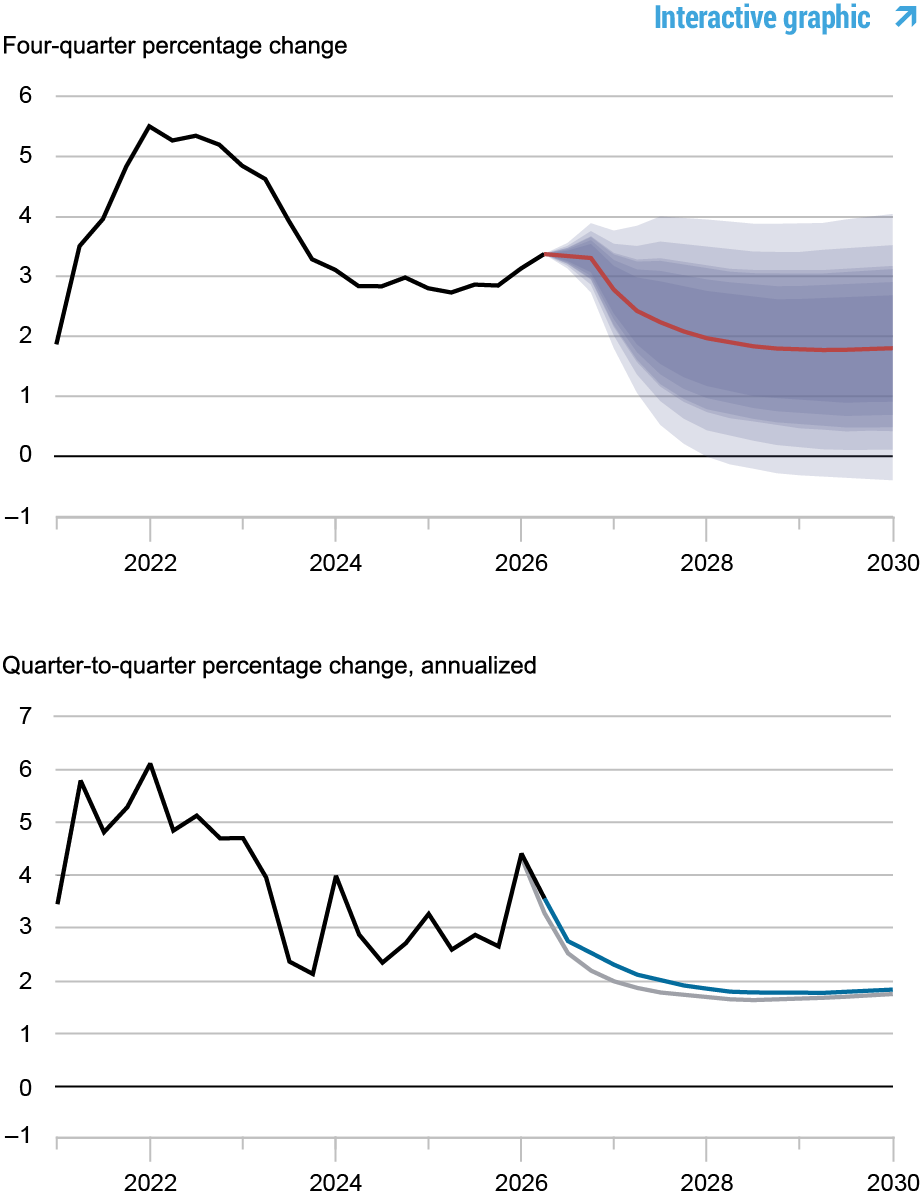
Notes: These two panels depict core personal consumption expenditures (PCE) inflation. In the top panel, the black line indicates actual data and the red line shows the model forecasts. The shaded areas mark the uncertainty associated with our forecasts at 50, 60, 70, 80, and 90 percent probability intervals. In the bottom panel, the blue line shows the current forecast (quarter-to-quarter, annualized), and the gray line shows the June 2026 forecast.
Real Natural Rate of Interest
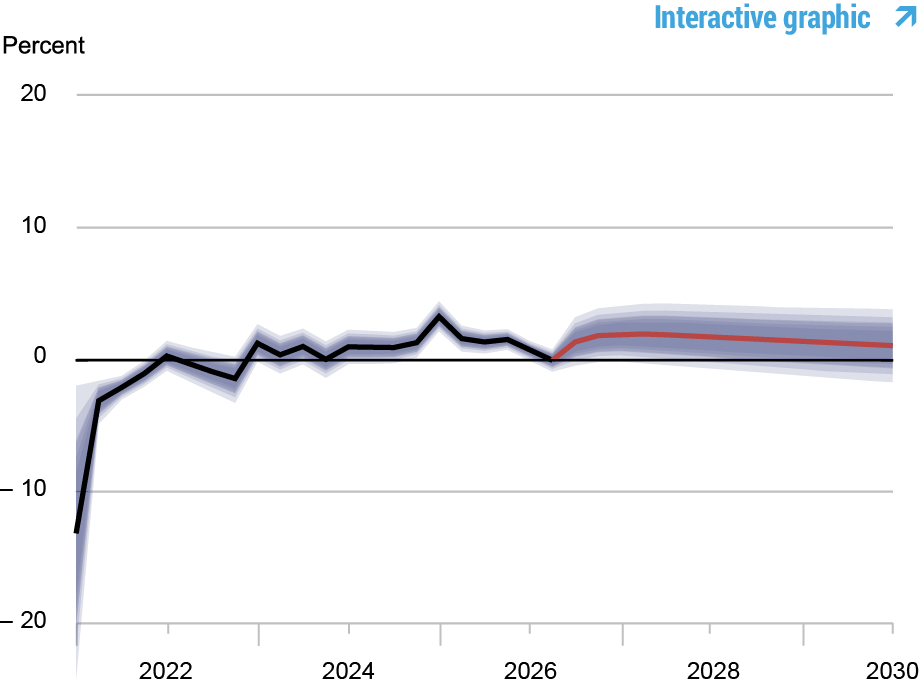
Notes: The black line shows the model’s mean estimate of the real natural rate of interest; the red line shows the model forecast of the real natural rate. The shaded area marks the uncertainty associated with the forecasts at 50, 60, 70, 80, and 90 percent probability intervals.

Marco Del Negro is an economic research advisor in the Federal Reserve Bank of New York’s Research and Statistics Group.

Keshav Dogra is an economic research advisor in the Federal Reserve Bank of New York’s Research and Statistics Group.

Elena Elbarmi is a research analyst in the Federal Reserve Bank of New York’s Research and Statistics Group.

Donggyu Lee is a research economist in the Federal Reserve Bank of New York’s Research and Statistics Group.

Michael Pham is a research analyst in the Federal Reserve Bank of New York’s Research and Statistics Group.

Elizabeth Wright is a research analyst in the Federal Reserve Bank of New York’s Research and Statistics Group.
How to cite this post:
Marco Del Negro, Keshav Dogra, Elena Elbarmi, Donggyu Lee, Michael Pham, and Elizabeth Wright, “The New York Fed DSGE Model Forecast—September 2026,” Federal Reserve Bank of New York Liberty Street Economics, September 18, 2026, https://libertystreeteconomics.newyorkfed.org/2026/09/the-new-york-fed-dsge-model-forecast-september-2026/
BibTeX: View |



Disclaimer
The views expressed in this post are those of the author(s) and do not necessarily reflect the position of the Federal Reserve Bank of New York or the Federal Reserve System. Any errors or omissions are the responsibility of the author(s).
 You can follow this conversation by subscribing to the comment feed for this post.
 RSS Feed
 Follow Liberty Street Economics
