Liberty Street Economics

November 29, 2023

Treasury Bill Supply and ON RRP Investment

Decorative photo: close up of the words "The Treasury" on the treasury building showing the top of the columns outside the structure.

Take-up at the Federal Reserve’s Overnight Reverse Repo Facility (ON RRP) increased from a few billion dollars in January 2021 to around $2.6 trillion at the end of December 2022.  In this post, based on a recent Staff Report, we explain how the supply of U.S. Treasury bills (T-bills) affects the decision of money market mutual funds (MMFs) to invest at the facility. We show that MMFs responded to a reduction in T-bill supply by increasing their take-up at the ON RRP, helping to explain the increased overall take-up.

Posted at 7:00 am in Financial Markets | Permalink
November 28, 2023

Bond Funds in the Aftermath of SVB’s Collapse

Decorative image: Bond market screen with rising yields and interest rates

March 2023 will rightfully be remembered as a period of major turmoil for the U.S. banking industry. In this post, we go beyond banks to analyze how fixed-income, open-end funds (bond funds) fared in the days after the start of the banking crisis. We find that bond funds experienced net outflows each day for almost three weeks after the run on Silicon Valley Bank (SVB), and that these outflows were experienced diffusely across the entire segment. Our preliminary evidence suggests that the outflows from bond funds may have been an unintended consequence of the exceptional measures taken to strengthen the balance sheet of banks during this time.

Posted at 7:00 am in Banks, Financial Markets | Permalink
November 27, 2023

The Nonbank Shadow of Banks

Decorative image: Aerial view of money transfer icon over cityscape

Financial and technological innovation and changes in the macroeconomic environment have led to the growth of nonbank financial institutions (NBFIs), and to the possible displacement of banks in the provision of traditional financial intermediation services (deposit taking, loan making, and facilitation of payments). In this post, we look at the joint evolution of banks—referred to as depository institutions from here on—and nonbanks inside the organizational structure of bank holding companies (BHCs). Using a unique database of the organizational structure of all BHCs ever in existence since the 1970s, we document the evolution of NBFI activities within BHCs. Our evidence suggests that there exist important conglomeration synergies to having both banks and NBFIs under the same organizational umbrella.

Posted at 7:00 am in Banks, Nonbank (NBFI) | Permalink
November 21, 2023

The New York Fed DSGE Model Perspective on the Lagged Effect of Monetary Policy

Decorative image: Factory workers on an assembly line with baseball caps on.

This post uses the New York Fed DSGE model to ask the question: What would have happened to interest rates, output, and inflation had the Federal Reserve been following an average inflation targeting (AIT)-type reaction function since 2021:Q2, when inflation began to rise—as opposed to keeping the federal funds rate at the zero lower bound (ZLB) until March 2022, and then raising it aggressively thereafter? We show that actual policy was more accommodative in 2021 than implied by the AIT reaction function and then more contractionary in 2022 and beyond. On net, the lagged effect of monetary policy on the level of GDP, when measured relative to the counterfactual, has been positive throughout the forecast horizon, due to the initial boost associated with keeping the fed funds rate near zero in 2021.

Posted at 7:01 am in DSGE, Monetary Policy | Permalink

A Bayesian VAR Model Perspective on the Lagged Effect of Monetary Policy

Decorative image: Factory workers on an assembly line with baseball caps on.

Over the last few years, the U.S. economy has experienced unusually high inflation and an unprecedented pace of monetary policy tightening. While inflation has fallen recently, it remains above target, and the economy continues to expand at a robust pace. Does the resilience of the U.S. economy imply that monetary policy has been ineffectual? Or does it reflect that policy acts with “long and variable lags” and so we haven’t yet observed the full effect of the monetary tightening that has already taken place? Using a Bayesian vector autoregressive (BVAR) model, we show that economic activity has, indeed, been substantially stronger than would have been anticipated considering the rapid policy tightening. Still, the model expects a significant slowdown in 2024-25, even though short-term interest rates are forecasted to fall.

November 20, 2023

Banks versus Hurricanes

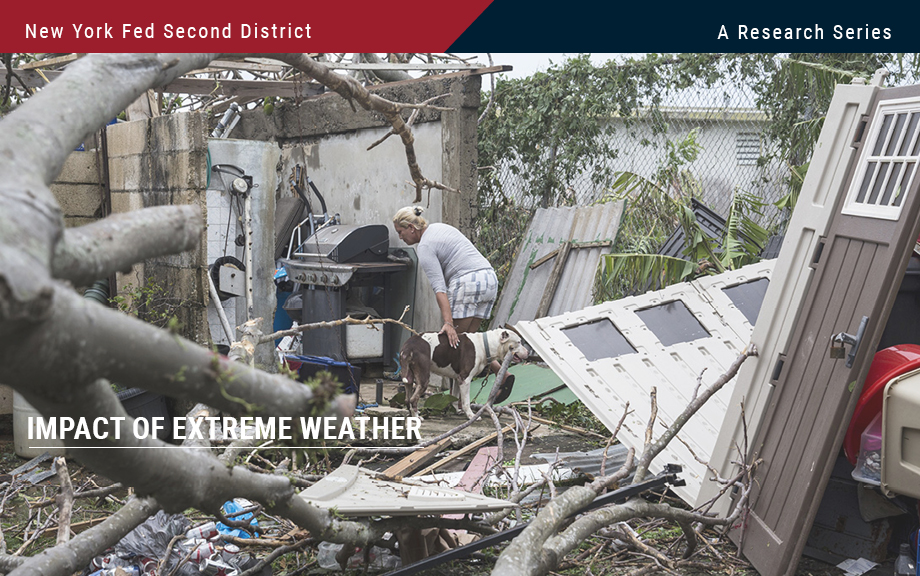
Woman looking over the debris left by hurricane of her home in Puerto Rico.

The impacts of hurricanes analyzed in the previous post in this series may be far-reaching in the Second District. In a new Staff Report, we study how banks in Puerto Rico fared after Hurricane Maria struck the island on September 17, 2017. Maria makes a worst case in some respects because the economy and banks there were vulnerable beforehand, and because Maria struck just two weeks after Hurricane Irma flooded the island. Despite the immense destruction and disruption Maria caused, we find that the island’s economy and banks recovered surprisingly quickly. We discuss the various protections—including homeowners’ insurance, federal aid, and mortgage guarantees—that helped buttress the island’s economy and banks.

Posted at 7:00 am in Banks, Climate Change | Permalink
November 17, 2023

Flood‑Prone Basement Housing in New York City and the Impact on Low‑ and Moderate‑Income Renters

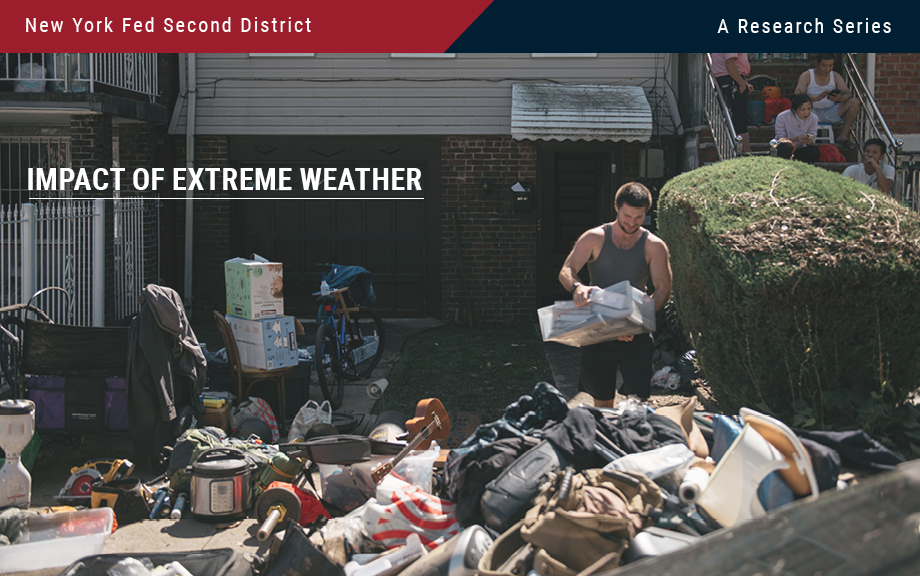
Decorative image: Man in front of a house with belongings from flood damage.

Hurricane Ida, which struck New York in early September 2021, exposed the region’s vulnerability to extreme rainfall and inland flooding. The storm created massive damage to the housing stock, particularly low-lying units. This post measures the storm’s impact on basement housing stock and, following the focus on more-at-risk populations from the two previous entries in this series, analyzes the attendant impact on low-income and immigrant populations. We find that basements in select census tracts are at high risk of flooding, affecting an estimated 10 percent of low-income and immigrant New Yorkers.

Posted at 7:00 am in Climate Change, Inequality, New York | Permalink
November 16, 2023

Small Business Recovery after Natural Disasters in the Fed’s Second District

A previous Liberty Street Economics post found that minority-owned small businesses in the Federal Reserve’s Second District have been particularly vulnerable to natural disasters. Here we focus on the aftermath of disasters (such as hurricanes, floods, wildfires, droughts, and winter storms) and examine disparities in the ability of these firms to reopen their businesses and access disaster relief. Our results indicate that while white- and minority-owned firms remain closed for similar durations, the latter are more reliant on external funding from government and private sources to cope with disaster losses.

November 15, 2023

How Do Natural Disasters Affect Small Business Owners in the Fed’s Second District?

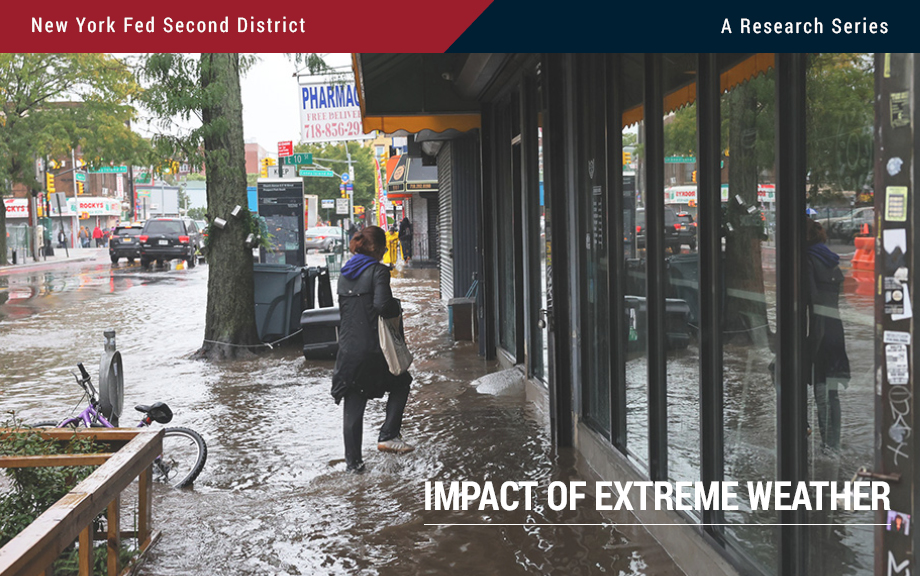
Decorative image: Woman walking in flood water to go shopping.

In this post, we follow up on the previous Liberty Street Economics post in this series by studying other impacts of extreme weather on the real sector. Data from the Federal Reserve’s Small Business Credit Survey (SBCS) shed light on how small businesses in the Second District are impacted by natural disasters (such as hurricanes, floods, wildfires, droughts, and winter storms). Among our findings are that increasing shares of small business firms in the region sustain losses from natural disasters, with minority-owned firms suffering losses at a disproportionately higher rate than white-owned firms. For many minority-owned firms, these losses make up a larger portion of their total revenues. In a companion post, we will explore the post-disaster recovery of small firms in the Second District: how long do they remain closed and what are their sources of disaster relief?

November 14, 2023

Flood Risk and Firm Location Decisions in the Fed’s Second District

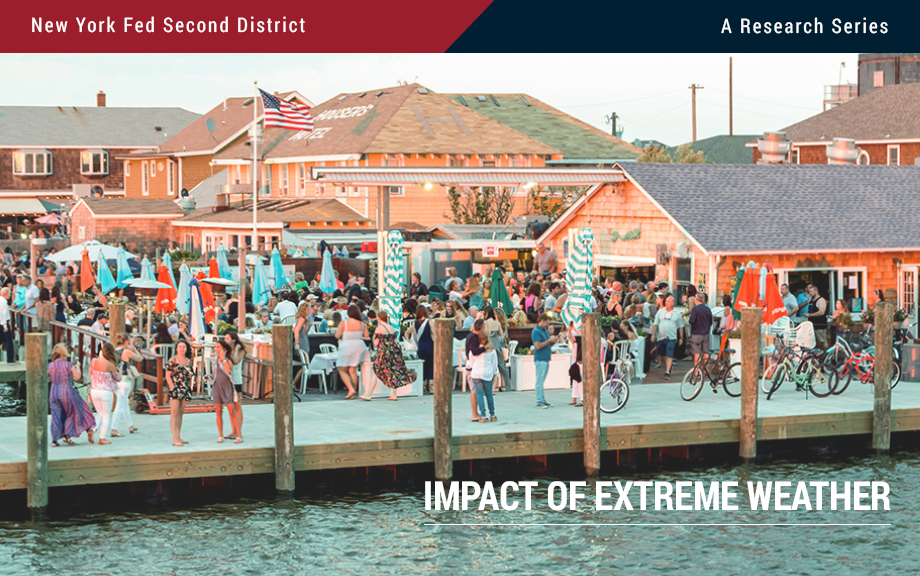
Photo of long island restaurant near the ocean and bay with people having food and cocktails.

The intensity, duration, and frequency of flooding have increased over the past few decades. According to the Federal Emergency Management Agency (FEMA), 99 percent of U.S. counties have been impacted by a flooding event since 1999. As the frequency of flood events continues to increase, the number of people, buildings, and agriculture exposed to flood risk is only likely to grow. As a previous post points out, measuring the geographical accuracy of such risk is important and may impact bank lending. In this post, we focus on the distribution of flood risk within the Federal Reserve’s Second District and examine its effect on establishment location decisions over the last two decades.

Posted at 7:00 am in Climate Change | Permalink
About the Blog

Liberty Street Economics features insight and analysis from New York Fed economists working at the intersection of research and policy. Launched in 2011, the blog takes its name from the Bank’s headquarters at 33 Liberty Street in Manhattan’s Financial District.

The editors are Michael Fleming, Andrew Haughwout, Thomas Klitgaard, and Asani Sarkar, all economists in the Bank’s Research Group.

Liberty Street Economics does not publish new posts during the blackout periods surrounding Federal Open Market Committee meetings.

The views expressed are those of the authors, and do not necessarily reflect the position of the New York Fed or the Federal Reserve System.

Economic Research Tracker

Image of NYFED Economic Research Tracker Icon Liberty Street Economics is available on the iPhone® and iPad® and can be customized by economic research topic or economist.

Economic Inequality

image of inequality icons for the Economic Inequality: A Research Series

This ongoing Liberty Street Economics series analyzes disparities in economic and policy outcomes by race, gender, age, region, income, and other factors.

Most Read this Year

Comment Guidelines


We encourage your comments and queries on our posts and will publish them (below the post) subject to the following guidelines:

Please be brief: Comments are limited to 1,500 characters.

Please be aware: Comments submitted shortly before or during the FOMC blackout may not be published until after the blackout.

Please be relevant: Comments are moderated and will not appear until they have been reviewed to ensure that they are substantive and clearly related to the topic of the post.

Please be respectful: We reserve the right not to post any comment, and will not post comments that are abusive, harassing, obscene, or commercial in nature. No notice will be given regarding whether a submission will or will
not be posted.‎

Comments with links: Please do not include any links in your comment, even if you feel the links will contribute to the discussion. Comments with links will not be posted.

Send Us Feedback

Disclosure Policy

The LSE editors ask authors submitting a post to the blog to confirm that they have no conflicts of interest as defined by the American Economic Association in its Disclosure Policy. If an author has sources of financial support or other interests that could be perceived as influencing the research presented in the post, we disclose that fact in a statement prepared by the author and appended to the author information at the end of the post. If the author has no such interests to disclose, no statement is provided. Note, however, that we do indicate in all cases if a data vendor or other party has a right to review a post.

Archives