Gauging the Strength of China’s Economy in Uncertain Times

Amid increasing pressure on the Chinese economy from China’s trade conflict with the U.S., assessing the strength of the Chinese economy will be an important watch point. In this post, we provide an update on China’s recent economic performance and policy changes. While China is likely to counter growth headwinds from the escalating trade tensions with additional policy stimulus, the country’s complex fiscal dynamics and the varying interpretations of the strength of its economic growth made judgments of the efficacy of China’s policy response challenging even in a more predictable environment. In this respect, we argue that aggregate credit is a simple and effective measure to gauge policy stimulus in China. At present, China’s “credit impulse”—the change in the flow of new aggregate credit to the economy relative to GDP—appears likely sufficient to allow it to muddle through with steady but not strong growth over the next year despite the intensifying trade conflict.
U.S. Imports from China Have Fallen by Less Than U.S. Data Indicate
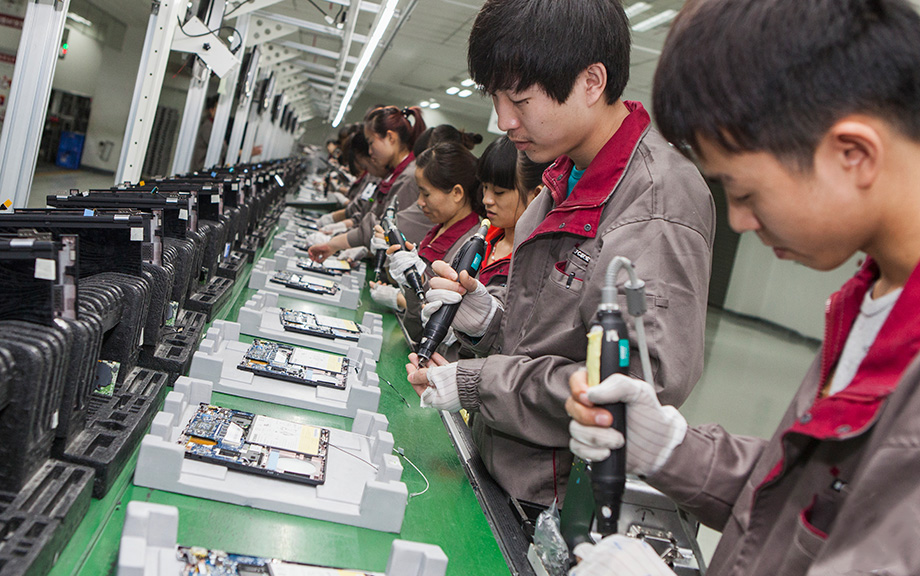
With new tariffs on China back in the headlines, this post seeks to offer some perspective on how much China’s exports have really been affected by multiple rounds of U.S. tariffs and export restrictions over the past seven years. The key takeaway is that U.S. imports from China have decreased by much less than has been reported in official U.S. statistics. As a result, the recent tariff increase on China could have a larger impact on the U.S. economy than is suggested by official U.S. data on the China import share, especially if favorable tariff treatment for direct-to-consumer imports is ended.
Using Stock Returns to Assess the Aggregate Effect of the U.S.‑China Trade War
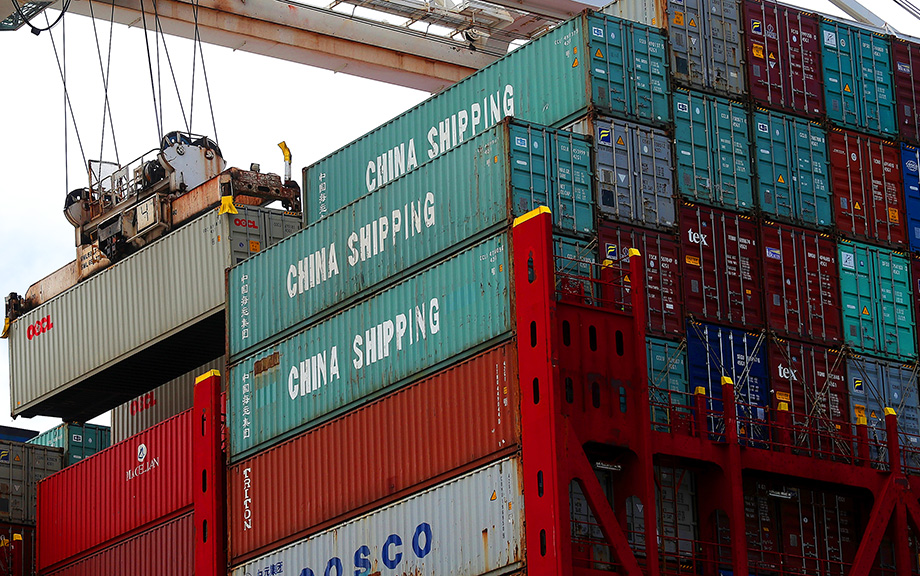
During 2018-19, the U.S. levied import tariffs of 10 to 50 percent on more than $300 billion of imports from China, and in response China retaliated with high tariffs of its own on U.S. exports. Estimating the aggregate impact of the trade war on the U.S. economy is challenging because tariffs can affect the economy through many different channels. In addition to changing relative prices, tariffs can impact productivity and economic uncertainty. Moreover, these effects can take years to become apparent in the data, and it is difficult to know what the future implications of a tariff are likely to be. In a recent paper, we argue that financial market data can be very useful in this context because market participants have strong incentives to carefully analyze the implications of a tariff announcement on firm profitability through various channels. We show that researchers can use movements in asset prices on days in which tariffs are announced to obtain estimates of market expectations of the present discounted value of firm cash flows, which then can be used to assess the welfare impact of tariffs. These estimates suggest that the trade war between the U.S. and China between 2018 and 2019 had a negative effect on the U.S. economy that is substantially larger than past estimates.
Why Investment‑Led Growth Lowers Chinese Living Standards

Rapid GDP growth, due in part to high rates of investment and capital accumulation, has raised China out of poverty and into middle-income status. But progress in raising living standards has lagged, as a side-effect of policies favoring investment over consumption. At present, consumption per capita stands some 40 percent below what might be expected given China’s income level. We quantify China’s consumption prospects via the lens of the neoclassical growth model. We find that shifting the country’s production mix toward consumption would raise both current and future living standards, with the latter result owing to diminishing returns to capital accumulation. Chinese policy, however, appears to be moving in the opposite direction, to reemphasize investment-led growth.
What Happens to U.S. Activity and Inflation if China’s Property Sector Leads to a Crisis?

A previous post explored the potential implications for U.S. growth and inflation of a manufacturing-led boom in China. This post considers spillovers to the U.S. from a downside scenario, one in which China’s ongoing property sector slump takes another leg down and precipitates an economic hard landing and financial crisis.
What if China Manufactures a Sugar High?
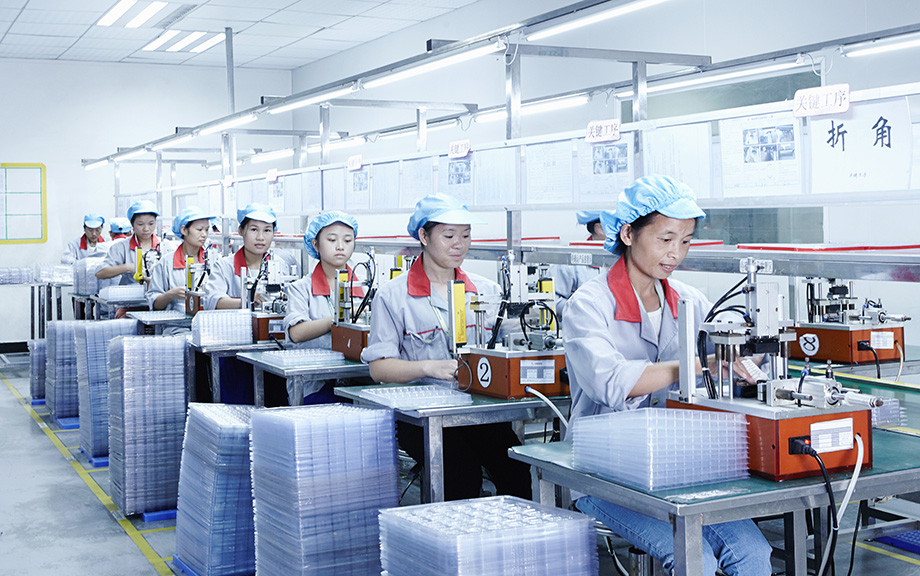
While the slump in China’s property sector has been steep, Chinese policymakers have responded to the falloff in property activity with policies designed to spur activity in the manufacturing sector. The apparent hope is that a pivot toward production-intensive growth can help lift the Chinese economy out of its current doldrums, which include weak household demand, high levels of debt, and demographic and political headwinds to growth. In a series of posts, we consider the implications of two alternative Chinese policy scenarios for the risks to the U.S. outlook for real activity and inflation over the next two years. Here, we consider the impact of a scenario in which a credit-fueled boom in manufacturing activity produces higher-than-expected economic growth in China. A key finding is that such a boom would put meaningful upward pressure on U.S. inflation.
Global Supply Chains and U.S. Import Price Inflation

Inflation around the world increased dramatically with the reopening of economies following COVID-19. After reaching a peak of 11 percent in the second quarter of 2021, world trade prices dropped by more than five percentage points by the middle of 2023. U.S. import prices followed a similar pattern, albeit with a lower peak and a deeper trough. In a new study, we investigate what drove these price movements by using information on the prices charged for products shipped from fifty-two exporters to fifty-two importers, comprising more than twenty-five million trade flows. We uncover several patterns in the data: (i) From 2021:Q1 to 2022:Q2, almost all of the growth in U.S. import prices can be attributed to global factors, that is, trends present in most countries; (ii) at the end of 2022, U.S. import price inflation started to be driven by U.S. demand factors; (iii) in 2023, foreign suppliers to the U.S. market caught up with demand and account for the decline in import price inflation, with a significant role played by China.
Can Electric Cars Power China’s Growth?

China’s aggressive policies to develop its battery-powered electric vehicle (BEV) industry have been successful in making the country the dominant producer of these vehicles worldwide. Going forward, BEVs will likely claim a growing share of global motor vehicle sales, helped along by subsides and mandates implemented in the United States, Europe, and elsewhere. Nevertheless, China’s success in selling BEVs may not contribute much to its GDP growth, owing both to the maturity of its motor vehicle sector and the strong tendency for countries to protect this high-profile industry.
Can China Catch Up with Greece?

China’s leader Xi Jinping recently laid out the goal of reaching the per capita income of “a mid-level developed country by 2035.” Is this goal likely to be achieved? Not in our view. Continued rapid growth faces mounting headwinds from population aging and from diminishing returns to China’s investment-centered growth model. Additional impediments to growth appear to be building, including a turn toward increased state management of the economy, the crystallization of legacy credit issues in real estate and other sectors, and limits on access to key foreign technologies. Even given generous assumptions concerning future growth fundamentals, China appears likely to close only a fraction of the gap with high-income countries in the years ahead.
Global Supply Chain Pressure Index: The China Factor

In a January 2022 post, we first presented the Global Supply Chain Pressure Index (GSCPI), a parsimonious global measure designed to capture supply chain disruptions using a range of indicators. In this post, we review GSCPI readings through December 2022, and then briefly discuss the drivers of recent moves in the index. While supply chain disruptions have significantly diminished over the course of 2022, the reversion of the index toward a normal historical range has paused over the past three months. Our analysis attributes the recent pause largely to the pandemic in China amid an easing of “Zero COVID” policies.


 RSS Feed
 Follow Liberty Street Economics