


287 posts on "Liberty Street Economics"
May 8, 2024
How Are They Now? A Checkup on Homeowners Who Experienced Foreclosure
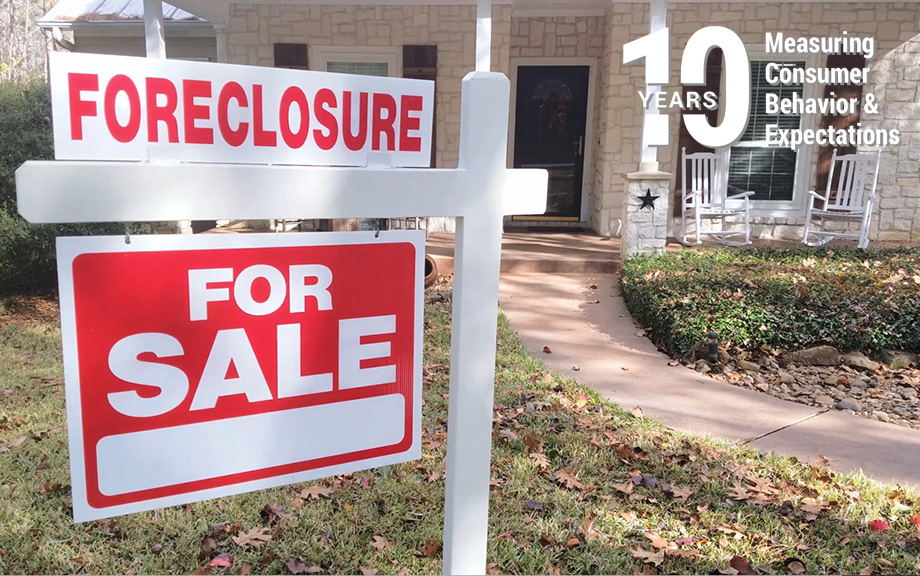
The end of the Great Recession marked the beginning of the longest economic expansion in U.S. history. The Great Recession, with its dramatic housing bust, led to a wave of home foreclosures as overleveraged borrowers found themselves unable to meet their payment obligations. In early 2009, the New York Fed’s Research Group launched the Consumer Credit Panel (CCP), a foundational data set of the Center for Microeconomic Data, to monitor the financial health of Americans as the economy recovered. The CCP, which is based on anonymized credit report data from Equifax, gives us an opportunity to track individuals during the period leading to the foreclosure, observe when a flag is added to their credit report and then—years later—removed. Here, we examine the longer-term impact of a foreclosure on borrowers’ credit scores and borrowing experiences: do they return to borrowing, or shy away from credit use and homeownership after their earlier bad experience?
May 6, 2024
Mortgage Rate Lock‑In and Homeowners’ Moving Plans

The U.S. housing market has had a tumultuous few years. After falling to record lows during the pandemic, the average 30-year mortgage rate rapidly increased in 2022 and 2023 and now hovers near a two-decade high of 7.2 percent. For those that locked in a low mortgage rate prior to 2022, this steep increase has significantly increased the cost of moving, as taking out a mortgage at current rates would potentially increase their monthly housing payment by hundreds or thousands of dollars, even if the amount they borrowed remained unchanged. As shown by Ferreira et al. (2011), this lock-in effect has the potential to reduce geographic mobility and turnover in the housing market and has gained the attention of Federal Reserve leaders. In this post, we utilize special questions from the Federal Reserve Bank of New York’s 2023 and 2024 SCE Housing Surveys to estimate the extent to which mortgage rate lock-in is suppressing U.S. household’s moving plans.
April 17, 2024
The New York Fed Consumer Credit Panel: A Foundational CMD Data Set

As the Great Financial Crisis and associated recession were unfolding in 2009, researchers at the New York Fed joined colleagues at the Board of Governors and Philadelphia Fed to create a new kind of data set. Household liabilities, particularly mortgages, had gone from being a quiet little corner of the financial system to the center of the worst financial crisis and sharpest recession in decades. The new data set was designed to provide fresh insights into this part of the economy, especially the behavior of mortgage borrowers. In the fifteen years since that effort came to fruition, the New York Fed Consumer Credit Panel (CCP) has provided many valuable insights into household behavior and its implications for the macro economy and financial stability.
The CCP was one of the first data sets drawn from credit bureau data, one of the earliest features of the Center for Microeconomic Data (CMD), and the primary source material for some of the CMD’s most important contributions to policy and research. Here we review a few of the main household debt themes over the past fifteen years, and how our analyses contributed to their understanding.
April 12, 2024
The Anatomy of Export Controls
Editor's note: We corrected the first chart in this post to include missing data for the number of affected U.S. suppliers in 2016 in the histogram. Chart data is available for download via link at the foot of the post. (June 12)

Governments increasingly use export controls to limit the spread of domestic cutting-edge technologies to other countries. The sectors that are currently involved in this geopolitical race include semiconductors, telecommunications, and artificial intelligence. Despite their growing adoption, little is known about the effect of export controls on supply chains and the productive sector at large. Do export controls induce a selective decoupling of the targeted goods and sectors? How do global customer-supplier relations react to export controls? What are their effects on the productive sector? In this post, which is based on a related staff report, we analyze the supply chain reconfiguration and associated financial and real effects following the imposition of export controls by the U.S. government.
April 10, 2024
A Retrospective on the Life Insurance Sector after the Failure of Silicon Valley Bank

Following the Silicon Valley Bank collapse, the stock prices of U.S banks fell amid concerns about the exposure of the banking sector to interest rate risk. Thus, between March 8 and March 15, 2023, the S&P 500 Bank index dropped 12.8 percent relative to S&P 500 returns (see right panel of the chart below). The stock prices of insurance companies tumbled as well, with the S&P 500 Insurance index losing 6.4 percent relative to S&P 500 returns over the same time interval (see the center panel below). Yet, insurance companies’ direct exposure to the three failed banks (Silicon Valley Bank, Silvergate, and Signature Bank) through debt and equity was modest. In this post, we examine the possible factors behind the reaction of insurance investors to the failure of Silicon Valley Bank.
Posted at 7:00 am in Financial Institutions | Permalink
April 8, 2024
Internal Liquidity’s Value in a Financial Crisis

A classic question for U.S. financial firms is whether to organize themselves as entities that are affiliated with a bank-holding company (BHC). This affiliation brings benefits, such as access to liquidity from other affiliated entities, as well as costs, particularly a larger regulatory burden. This post highlights the results from a recent Staff Report that sheds light on this tradeoff. This work uses confidential data on the population of broker-dealers to study the benefits of being affiliated with a BHC, with a focus on the global financial crisis (GFC). The analysis reveals that affiliation with a BHC makes broker-dealers more resilient to the aggregate liquidity shocks that prevailed during the GFC. This results in these broker-dealers being more willing to hold riskier securities on their balance sheet relative to broker-dealers that are not affiliated with a BHC.
April 3, 2024
Physical Climate Risk and Insurers

As the frequency and severity of natural disasters increase with climate change, insurance—the main tool for households and businesses to hedge natural disaster risks—becomes increasingly important. Can the insurance sector withstand the stress of climate change? To answer this question, it is necessary to first understand insurers’ exposure to physical climate risk, that is, risks coming from physical manifestations of climate change, such as natural disasters. In this post, based on our recent staff report, we construct a novel factor to measure the aggregate physical climate risk in the financial market and discuss its applications, including the assessment of insurers’ exposure to climate risk and the expected capital shortfall of insurers under climate stress scenarios.
March 27, 2024
Deposits and the March 2023 Banking Crisis—A Retrospective

In this post, we evaluate how deposits have evolved over the latter portion of the current monetary policy tightening cycle. We find that while deposit betas have continued to rise, they did not accelerate following the bank runs in March 2023. In addition, while overall deposit funding has remained stable, we find that the banks most affected by the March 2023 events are offering higher deposit rates and are growing their deposit funding relative to the broader banking industry.
March 26, 2024
What Happens to U.S. Activity and Inflation if China’s Property Sector Leads to a Crisis?

A previous post explored the potential implications for U.S. growth and inflation of a manufacturing-led boom in China. This post considers spillovers to the U.S. from a downside scenario, one in which China’s ongoing property sector slump takes another leg down and precipitates an economic hard landing and financial crisis.
March 8, 2024
Stablecoins and Crypto Shocks

In a previous post, we described the rapid growth of the stablecoin market over the past few years and then discussed the TerraUSD stablecoin run of May 2022. The TerraUSD run, however, is not the only episode of instability experienced by a stablecoin. Other noteworthy incidents include the June 2021 run on IRON and, more recently, the de-pegging of USD Coin’s secondary market price from $1.00 to $0.88 upon the failure of Silicon Valley Bank in March 2023. In this post, based on our recent staff report, we consider the following questions: Do stablecoin investors react to broad-based shocks in the crypto asset industry? Do the investors run from the entire stablecoin industry, or do they engage in a flight to safer stablecoins? We conclude with some high-level discussion points on potential regulations of stablecoins.
 RSS Feed
 Follow Liberty Street Economics