











The AI boom is showing up in different corners of the U.S. economy, including international trade. Imports of semiconductors, servers, and computing equipment have climbed sharply yet the U.S. current account deficit has been largely unchanged. To better understand how the AI boom has not substantially affected the trade balance, consider that the current account is dictated by the gap between domestic saving and investment spending. It turns out that aggregate saving and investment spending have not changed much during the AI boom. Aggregate investment has not risen due to weakness outside the AI sector and business saving has remained robust.
Gross Flows versus Net Positions
Recent work has shown that AI-related imports accounted for a nontrivial share of U.S. imports in the past few years. In fact, it reached a high of 23 percent in 2025. However, a country can import a great deal of capital equipment or attract a great deal of foreign capital without necessarily running a larger external deficit, provided it saves enough to pay for the investment spending itself. This idea can be formalized by noting that the current account is a net concept, where the balance equals a country’s gross saving less its gross domestic investment. A recent Liberty Street Economics post provides an in-depth explanation linking the trade balance to the savings and investment balance via national accounting.
For the AI boom to widen the deficit, it must raise investment without a matching rise in saving. Two channels can depress private saving: a wealth effect, where equity gains lift household consumption, or a fall in business saving. Both were at work during the dot-com era, when the two channels moved together.
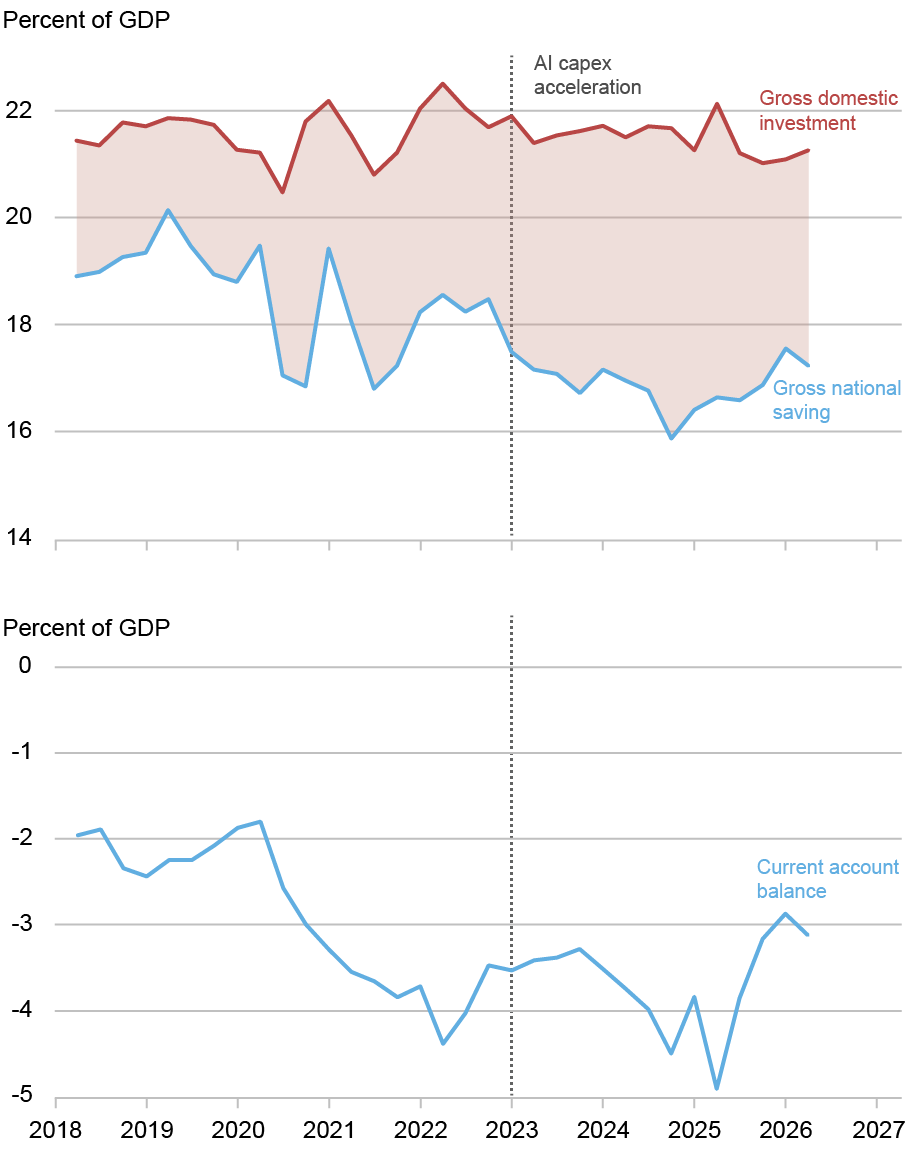
The top panel of chart below plots the savings-to-GDP and investment spending-to-GDP ratios since 2018, while the bottom panel plots the current account-to-GDP ratio. The current account deficit widened over this period, from roughly 2.2 percent of GDP on average in 2015–19 to about 3.7 percent since 2023. Notice, however, that the widening comes almost entirely from the saving side. Investment as a share of GDP has been remarkably steady, especially since 2023 when the AI capex buildout started in earnest.
Saving, Investment, and the Current Account
Investment Has Been Reallocated, Not Expanded
Gross domestic investment averaged 21.3 percent of GDP in the five years before the pandemic. Over 2023–2026:Q1 (the period spanning the AI capex acceleration), it averaged 21.5 percent, and over the past four quarters, 21.1 percent. The AI boom is thus not visible in the aggregate investment rate at all.
To better understand why the AI boom has not had a tangible impact on aggregate investment, it is useful to look at how investment has varied across sectors of the U.S. economy. As the chart below shows, the AI contribution to nonresidential investment has not been small and has been rising in recent years, but it has coincided with weakness in other sectors of the economy. For example, the surge in factory construction that followed the 2022 industrial policy legislation has faded, and investment in structures and equipment outside the technology complex has been soft. Data centers and information-processing equipment have helped take up the slack, but not to such an extent as to raise aggregate investment relative to national savings. Further, residential investment has been declining recently.
Composition of Nonresidential Investment
Percent of GDP
Consumption Has Also Not Adjusted
It is interesting to contrast how savings have adjusted during the AI boom thus far relative to the dot-com era, which is often highlighted as a period of elevated equity values. During the dot-com expansion, private saving fell by nearly 3 percentage points of GDP between 1995 and 2000 as households spent out of rising equity wealth. Nothing comparable is happening today. Private saving has averaged 20.8 percent of GDP since 2023, down from 21.3 percent before the pandemic—a difference of half a percentage point, and one that can be attributed as much to the post-pandemic unwinding of accumulated savings as to anything AI-related.
Business Sector Saving Has Not Fallen
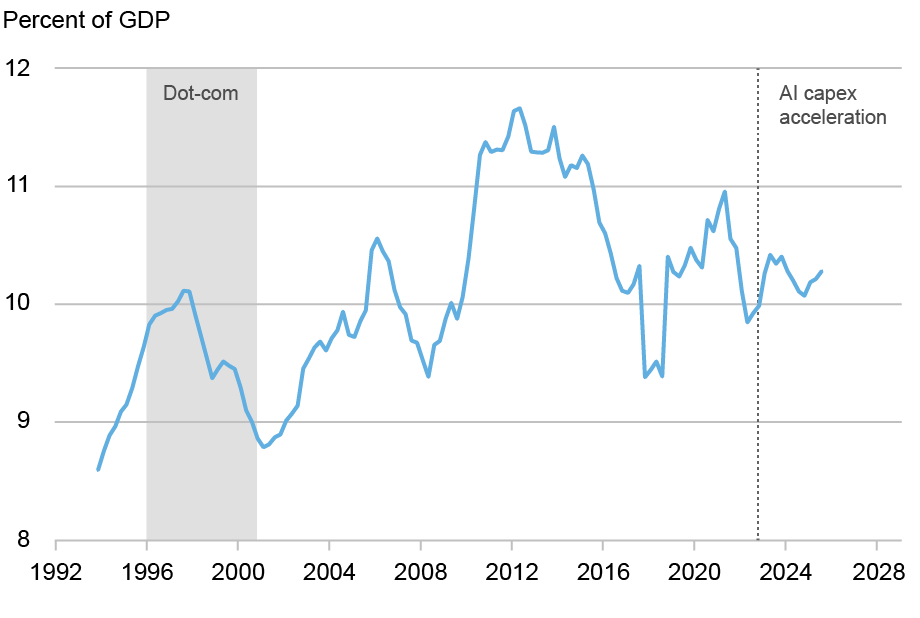
Let’s turn to business saving, defined as revenue minus expenses excluding investment spending. The salient difference between the dot-com and AI episodes is not the scale of the investment but the cash position of the firms doing it. The dot-com buildout was concentrated in young telecom and equipment producers with thin or negative operating cash flow; as profits compressed late in the boom while dividends remained sticky, retained earnings and with them business gross saving fell. Business saving was thus a drag on private saving at precisely the moment investment was peaking. The AI buildout, by contrast, is concentrated in the most cash-generative firms in the economy, and business saving has thus far held up through the capex surge rather than eroding against it.
The chart below illustrates these points by plotting the business sector’s savings rate over time. Business saving has averaged 10.9 percent of GDP over the past four quarters, in line with the roughly 10.5 percent averaged before the pandemic, and above the dot-com trough of roughly 8.8 percent of GDP in late 2000/early 2001.
Business Sector Saving
Government Saving Has Moved in the Opposite Direction
Government saving offers the sharpest contrast between the two episodes, and it runs in the opposite direction from private saving. During the dot-com expansion, government saving rose by nearly 5 percentage points of GDP, swinging from a deficit of about 1 percent of GDP in 1995 to a surplus of roughly 4 percent in 2000 as capital-gains-driven tax receipts flooded federal coffers. That fiscal windfall offset much of the pickup in private dissaving, which is one reason the current account deficit widened by “only” 2.5 percentage points even as households drew down saving so aggressively.
Today the fiscal position is doing the opposite work. Government saving has fallen from about –2.2 percent of GDP in 2015–19 to about –4.0 percent since 2023, a deterioration of roughly 1.75 percentage points.
Decomposing the Contributions to the Current Account Balance
Putting the above pieces together, the external balance can be decomposed into its three sources relative to a pre-pandemic baseline (that is, relative to 2019:Q4). Of the roughly 2.4 percentage point widening in the saving–investment gap, government dissaving accounts for about 1.75 percentage points, lower private saving for about half a point, and higher investment for essentially nothing. Therefore, changes in fiscal policy have been the major driver of current account dynamics, with a smaller role played by private saving, and no discernible investment channel.
Caveat and Why Things Could Change
There is an important caveat to note before drawing conclusions on the AI’s impact on the current account going forward. The announced capital spending plans of the major technology firms for 2026 and 2027 are considerably larger than what has already been built, while the offsetting weakness in residential and nontechnology investment will not persist indefinitely. So, while the AI boom has not yet been large enough relative to the rest of the economy to move the U.S. external balance, if the current drags on other investment fade as AI capex accelerates, both the higher investment spending and less business saving will work to increase the current account deficit.

Julian di Giovanni is an economic research advisor in the Federal Reserve Bank of New York’s Research and Statistics Group.
How to cite this post:
Julian di Giovanni, “Has the AI Boom Impacted the U.S. Current Account?,” Federal Reserve Bank of New York Liberty Street Economics, October 14, 2026, https://doi.org/10.59576/lse.20261014
BibTeX: View |



Disclaimer
The views expressed in this post are those of the author(s) and do not necessarily reflect the position of the Federal Reserve Bank of New York or the Federal Reserve System. Any errors or omissions are the responsibility of the author(s).
 You can follow this conversation by subscribing to the comment feed for this post.
 RSS Feed
 Follow Liberty Street Economics
