











From the Great Recession until 2019, U.S. labor productivity growth disappointed. Nonfarm-business output per hour grew about 1 percent a year from 2010 to 2019, down from 3 percent in the late 1990s. This slowdown was especially pronounced in manufacturing, and it coincided with a slowdown in the growth of revenue per worker among public firms. However, since 2019, growth has picked up to twice the 2010s rate, around 2 percent. In this post, I use data from firms’ 10-K filings to unpack this recent acceleration. I first show that the acceleration appears in public firms’ revenue per worker, then document how the gains went into profit margins, and finally, what firm characteristics predicted significant profit margin increases. The increase in profit margins is consistent with ongoing declines in the labor share of output.
Firm Productivity, 2019–2025
This piece studies U.S. Compustat firms across both manufacturing and services over 2010–2025, broken into two periods: 2010–2019 and 2019–2025. I drop agriculture, utilities, finance, real estate, and public administration, due to the known challenges of productivity measurement in those industries.
Nonfarm-business output per hour grew 1.0 percent a year from 2010 to 2019 and 2.2 percent a year from 2019 to 2025. In Compustat, I find a similar qualitative growth acceleration. Real revenue per worker—sales deflated by industry output prices, divided by employment—traces the same turn, from 0.7 percent to 2.2 percent a year over the same time periods.
The chart below illustrates this trend, showing that both revenue per worker among public firms and output per hour are accelerating in the recent period. Across all datasets, the labor productivity uptick is real.
Labor Productivity and Firm Revenue Per Worker Accelerated Together in 2019-2025
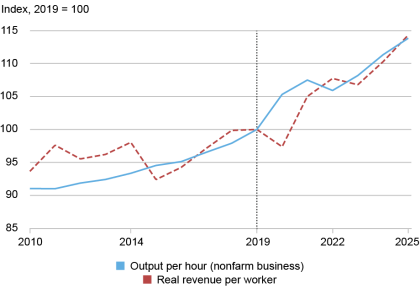
Notes: Labor productivity, indexed to 2019 = 100: Chart shows BLS nonfarm-business output per hour and Compustat real revenue per worker.
Higher revenue per worker at the firm level does not indicate who gains from this increased revenue. The additional revenue may go to workers, as firms compete for labor through higher wages, or accrue to firms in profit margins. Firm-level data let me measure how firms’ profit margins changed over time. I explore how profit margins changed between 2019 and 2025 and what firm characteristics predicted markup gains.
Firm Profit Margins
A profit margin is profit divided by sales: the share of each sales dollar the firm keeps after paying its costs. The gross margin subtracts the direct cost of production (cost of goods sold), while the operating margin also subtracts overhead (selling, general, and administrative expense, which in Compustat typically includes R&D). If productivity gains were flowing to firms’ profits, margins should show it. Through the 2010s margins were flat: gross margins grew about 0.4 percent a year from 2010 to 2019, and operating margins were roughly flat. Both then turned up: on average, gross margins went from about 34 percent of sales in 2019 to 37 percent in 2025 (1.3 percent growth per year), and operating margins from 16 percent to 18 percent (2.4 percent growth per year).
Gross and Operating Profit Margins Increased in
2019-2025
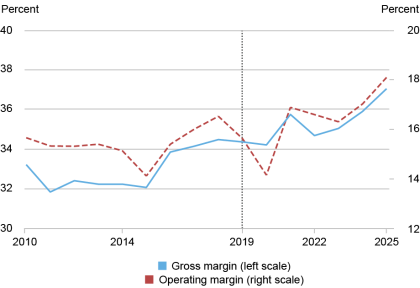
Notes: Compustat gross margin (COGS) and operating margin (OPEX), 2010–2025, sales-weighted; gross on the left scale, operating on the right scale.
Which Firms Saw the Largest Gains?
Lastly, I ask whether firms that invest in intangibles (e.g., research and development, or R&D) experienced the largest gains. In earlier work, we showed that while productivity growth in manufacturing slowed in the 2010s, R&D intensity in manufacturing continued to rise. Does R&D intensity predict higher profit margins in the recent era?
Firms that entered the period with higher R&D expenditure relative to sales saw larger subsequent gains: firms with 10 percent more R&D expenditure relative to sales in 2019 saw about 0.7 percent higher operating-markup growth over 2019–2025, and 0.5 percent over 2022–2025. Firms with higher capital intensity did not see such a significant pattern. This pattern is consistent with returns to intangible intensity rather than capital intensity. This suggests a potentially important role for investments in technology and intangibles in driving markups.
Measured productivity has risen since 2019 in both aggregate and firm data, ending more than a decade of slow growth. Part of the gains surfaced with wider profit margins: on a reasonable baseline, the operating margin rose over 2 percent a year from 2019 to 2025. R&D intensity appears to be an important predictor of margin growth for firms, consistent with the rising returns to high-tech firms and firms that have invested in intangibles since COVID. Whether these rising margins are returns to significant investment in intangibles or purely a windfall for firms is a topic to explore in future work.

Jeremy Pearce is a research economist in the Federal Reserve Bank of New York’s Research and Statistics Group.
How to cite this post:
Jeremy Pearce, “Revenue per Worker Is Up. Are Firms Getting a Larger Share?,” Federal Reserve Bank of New York Liberty Street Economics, October 15, 2026, https://doi.org/10.59576/lse.20261015
BibTeX: View |



Disclaimer
The views expressed in this post are those of the author(s) and do not necessarily reflect the position of the Federal Reserve Bank of New York or the Federal Reserve System. Any errors or omissions are the responsibility of the author(s).
 You can follow this conversation by subscribing to the comment feed for this post.
 RSS Feed
 Follow Liberty Street Economics
