









Has U.S. monetary policy actually improved over time? Or was the apparent success of the modern Federal Reserve mostly the result of more favorable economic conditions and better luck? In this post, we summarize our paper,* which develops a framework for comparing monetary policy across different economic environments. Our approach asks how close policy came to the best response given the economic conditions and shocks policymakers faced. Applying this framework to 150 years of U.S. monetary history, we find that meaningful improvements in monetary policy occurred only in the last thirty years. Most of the gains reflect, among other developments, substantially better responses to financial shocks and supply shocks.
Why Is Measuring Monetary Policy Performance So Difficult?
Evaluating monetary policy is fundamentally difficult because monetary policymakers do not have complete control over the environment in which they operate. One central banker may face a severe banking panic, while another presides over a long period of economic stability. Even if the first policymaker makes better decisions, she may nevertheless experience higher inflation and unemployment simply because the shocks hitting the economy are larger or more difficult to stabilize.
This distinction between policy and circumstances has long complicated comparisons across historical periods. Was the Great Moderation evidence of better monetary policy, or simply a period of smaller and less disruptive shocks? Likewise, should the early Federal Reserve be judged by the severity of the Great Depression, or by how effectively it responded to the extraordinary challenges it faced? Answering these questions requires separating policy quality from the economic environment.
Our framework addresses this challenge by comparing policymakers with the best policy response that was feasible given the shocks they faced. For a broad class of macroeconomic models, we show that this comparison can be implemented using empirically estimated impulse responses to policy and non-policy shocks rather than a fully specified structural model. The framework produces two complementary measures of performance. The first measures how the policymaker’s policy-path response to each shock should have been corrected and expresses this adjustment as a percentage of the observed response. The second, the distance to minimum loss, measures how much macroeconomic loss (in terms of expected squared inflation and unemployment deviations) could have been avoided under the best feasible response.
The policy-path correction thus assesses the reaction function directly, while the distance to minimum loss captures the economic consequences of policy mistakes. We apply these measures to four periods of U.S. monetary history: the pre-Fed Gold Standard era (1879–1912), the early Federal Reserve (1913–41), the postwar period (1954–84), and the post-Volcker era (1990–2019).
Finding #1: Meaningful Improvements in Monetary Policy Came Late?
Has the conduct of monetary policy steadily improved over the past 150 years? Our first finding suggests that the answer is no. While monetary policy today performs substantially better than in earlier periods, most of these gains emerged only after Chairman Paul Volcker’s disinflation program. There is surprisingly little evidence that the Federal Reserve’s systematic response to macroeconomic shocks improved materially before.
Evaluation U.S. Monetary Policy: 1879–2019
Percentage correction to policy path response
| Label | Period | Overall | Bank panics | Government Spending | Energy | πᵉ | TFP | MP |
|---|---|---|---|---|---|---|---|---|
| Gold Standard | 1879–1912 | — | -2 (-8.5,-0.3) | -0.8 (-2.6,0) | -0.1 (-1.8,0.6) | — | — | — |
| Early Fed | 1913–1941 | — | -3.2 (-8.6,-1.3) | -1.7 (-5.6,-0.4) | 0 (-0.8,1.3) | 2.2 (1,5.9) | — | — |
| Post WWII | 1951–1984 | — | — | -1 (-6.1,2.1) | 0.9 (0.1,2) | 6.9 (2.1,24.9) | 1.1 (-0.5,3.6) | — |
| Post Volcker | 1990–2019 | — | -0.3 (-1.2,0.3) | 0.2 (-1.3,1.8) | -0.6 (-5.1,3.6) | -0.2 (-2.1,1.4) | -1.1 (-5.3,0.4) | — |
Distance to Minimum Loss (DML)
| Label | Period | Overall | Bank panics | Government Spending | Energy | πᵉ | TFP | MP |
|---|---|---|---|---|---|---|---|---|
| Gold Standard | 1879–1912 | 8.4 (4.8,15.5) | 1.6 (0.3,3.6) | 0.6 (0.1,2.1) | 0.2 (0,0.6) | — | — | 1.5 (0.6,3.5) |
| Early Fed | 1913–1941 | 97.4 (57,230) | 29.4 (11.9,77.9) | 7.8 (1,28.5) | 1.7 (0.1,10.7) | 30.2 (9.6,76.7) | — | 14.8 (6.7,31.3) |
| Post WWII | 1951–1984 | 6.6 (3.8,12) | — | 0.2 (0,0.8) | 0.9 (0.1,4) | 1.7 (0.3,6.4) | 0.4 (0,2.6) | 0.9 (0.4,2.3) |
| Post Volcker | 1990–2019 | 3.2 (1.4,7.2) | 0.2 (0,0.7) | 0.1 (0,0.7) | 0.2 (0,0.9) | 0.1 (0,0.3) | 0.1 (0,0.5) | 0.9 (0.3,2.4) |
Notes: The top panel shows the median distance to minimum loss; total (first column) and shock-specific (bank panics, government spending, energy, inflation expectations (πᵉ), total factor productivity (TFP) and monetary policy (MP)) together with 68 percent credible sets in parentheses. The bottom panel shows the median optimal correction to the policy-path reaction to each identified macro shock with 68 panel credible sets in parentheses.
The top panel of the table above summarizes how many percentage points the interest rate path would have needed to be adjusted to achieve the best feasible policy. The smaller the number, the more appropriate the policy. The Gold Standard era, the early Federal Reserve, and the postwar period all exhibit large and significant deviations from the best feasible policy. In particular, the required corrections to the policy path remain above 100 percent on average throughout these periods, indicating that the systematic reaction function remained far from the optimum. Only in the post-Volcker period do these corrections become substantially smaller—and statistically insignificant—with an average absolute correction of around 30 percent. This provides evidence that the conduct of monetary policy improved substantially only during the last three decades.
That said, as the bottom panel of the table shows, the consequences of the policy mistakes, in terms of expected squared inflation and unemployment deviations, that could have been avoided vary dramatically across periods. For instance, the policy mistakes in the Early Fed period were far more costly when compared to those in the Gold Standard era and the Post WWII period.
Finding #2: The Fed Learned to Respond to Financial Crises
The largest improvements in monetary policy occurred in the response to financial shocks. Comparing the early Federal Reserve with the post-Volcker period reveals a striking contrast. During the 1920s and 1930s, the Federal Reserve’s response to banking panics was far from the best feasible policy. By contrast, the modern Federal Reserve responded much more appropriately, resulting in only small additional losses relative to the optimum.
The charts below illustrate this difference. During the Early Fed period, adverse financial shocks were followed by higher policy rates. Because banking panics also lowered inflation, the real policy rate increased substantially, making monetary policy contractionary precisely when the economy required additional support. Our estimated policy adjustment reverses this response: instead of raising interest rates, the optimal policy would have lowered them, substantially stabilizing both inflation and unemployment.
The picture is very different after Volcker. Following financial shocks, the Federal Reserve already lowers interest rates, and the estimated adjustment to the policy path is both much smaller and statistically insignificant. As a result, the additional macroeconomic losses associated with suboptimal policy are tiny compared with those during the Early Fed period.
Early Fed, 1913-41, Reaction to Financial Shocks
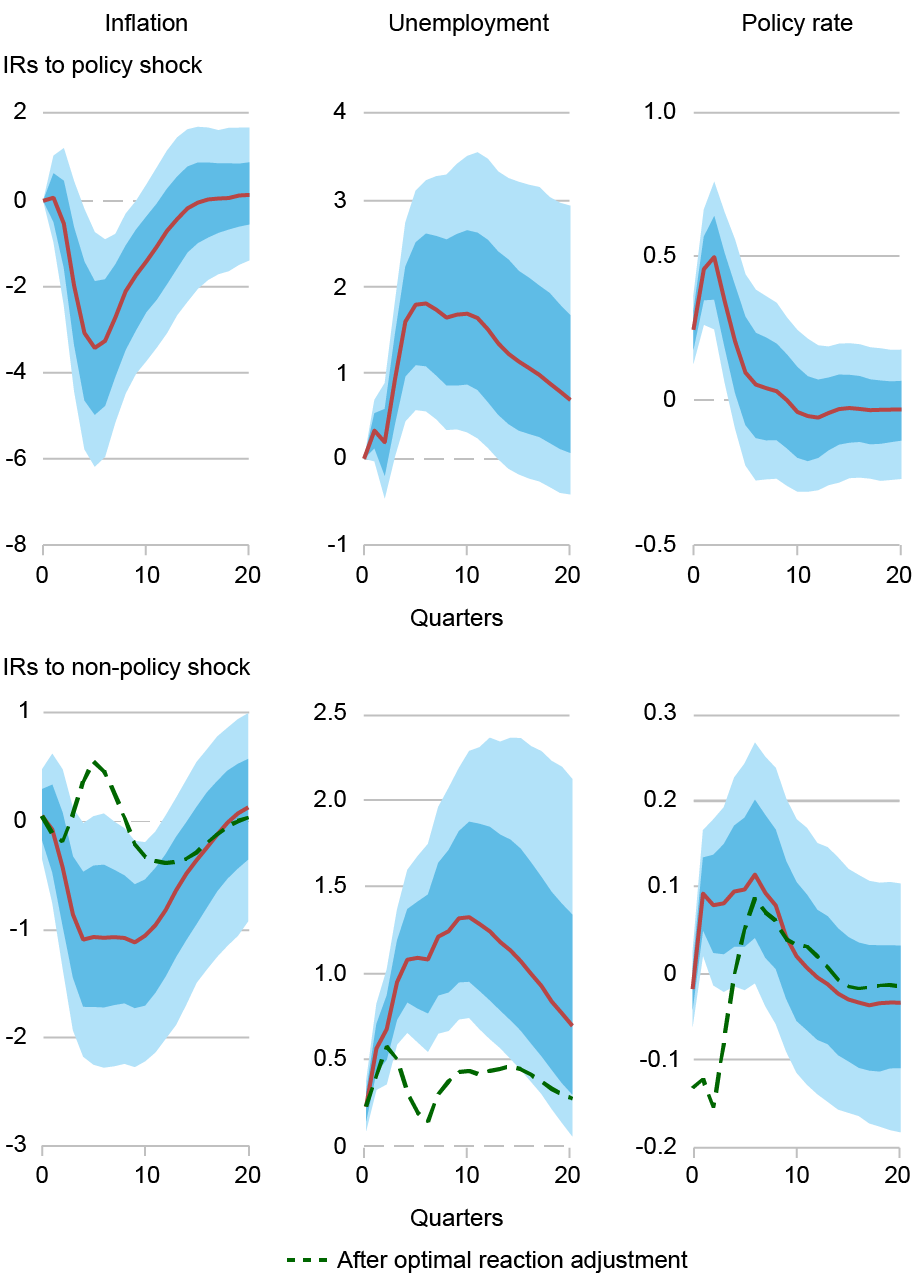
Notes: The top (resp. bottom) rows show the median quarterly responses (thick line) of inflation, unemployment and the Fed’s discount rate to a monetary policy shock (resp. financial shock as measured by bank panics). The dotted green lines show the optimally reaction adjusted (ORA) impulse responses. The 95% and 67% confidence bands.
Post Volcker Fed, 1990-2019, Reaction to Financial Shocks
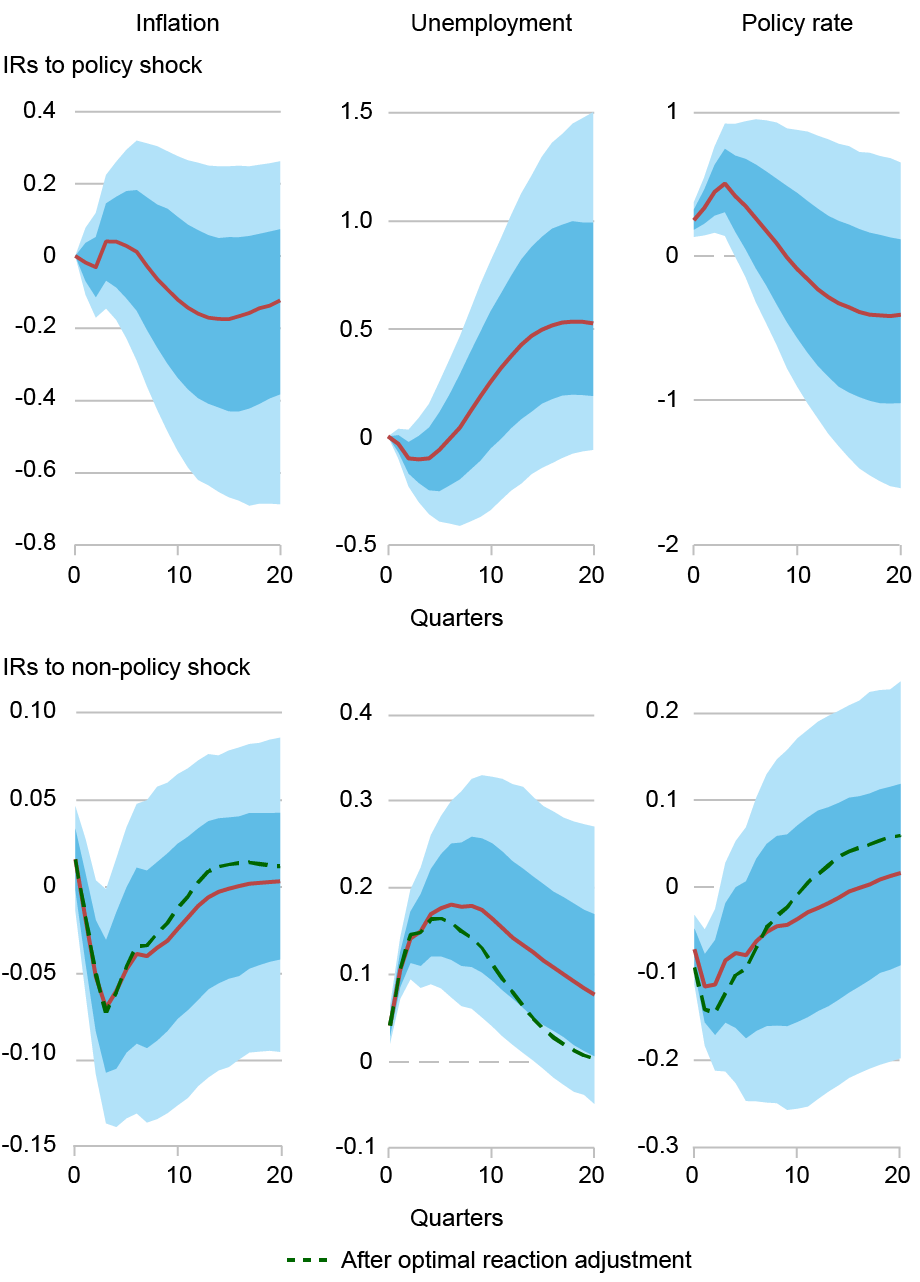
Notes: The top (resp. bottom) rows show the median quarterly responses (thick line) of inflation, unemployment and the Fed’s discount rate to a monetary policy shock (resp. financial shock as measured by bank panics). The dotted green lines show the optimally adjusted impulse responses. The 95% and 67% confidence bands.
Finding #3: The Great Inflation Reflected Weak Responses to Supply Shocks
The Great Inflation of the 1960s and 1970s is often viewed as one of the defining failures of U.S. monetary policy. Our framework provides a quantitative assessment of just how far policy deviated from the best feasible response.
Overall, we find that the Federal Reserve’s reaction function during this period was almost as far from the optimum as during the Early Fed period. Rather than responding poorly to financial crises, the postwar Federal Reserve reacted too weakly to a range of supply-side disturbances, including energy price shocks, productivity shocks, and inflation expectation shocks.
Following an inflation expectation shock, inflation rises steadily, but the policy rate responds only weakly. As a result, real interest rates fall, reinforcing inflationary pressures. The estimated policy adjustment restores a much stronger response of interest rates, consistent with the Taylor principle.
Post WWII Fed, 1951-84, Reaction to e Shocks
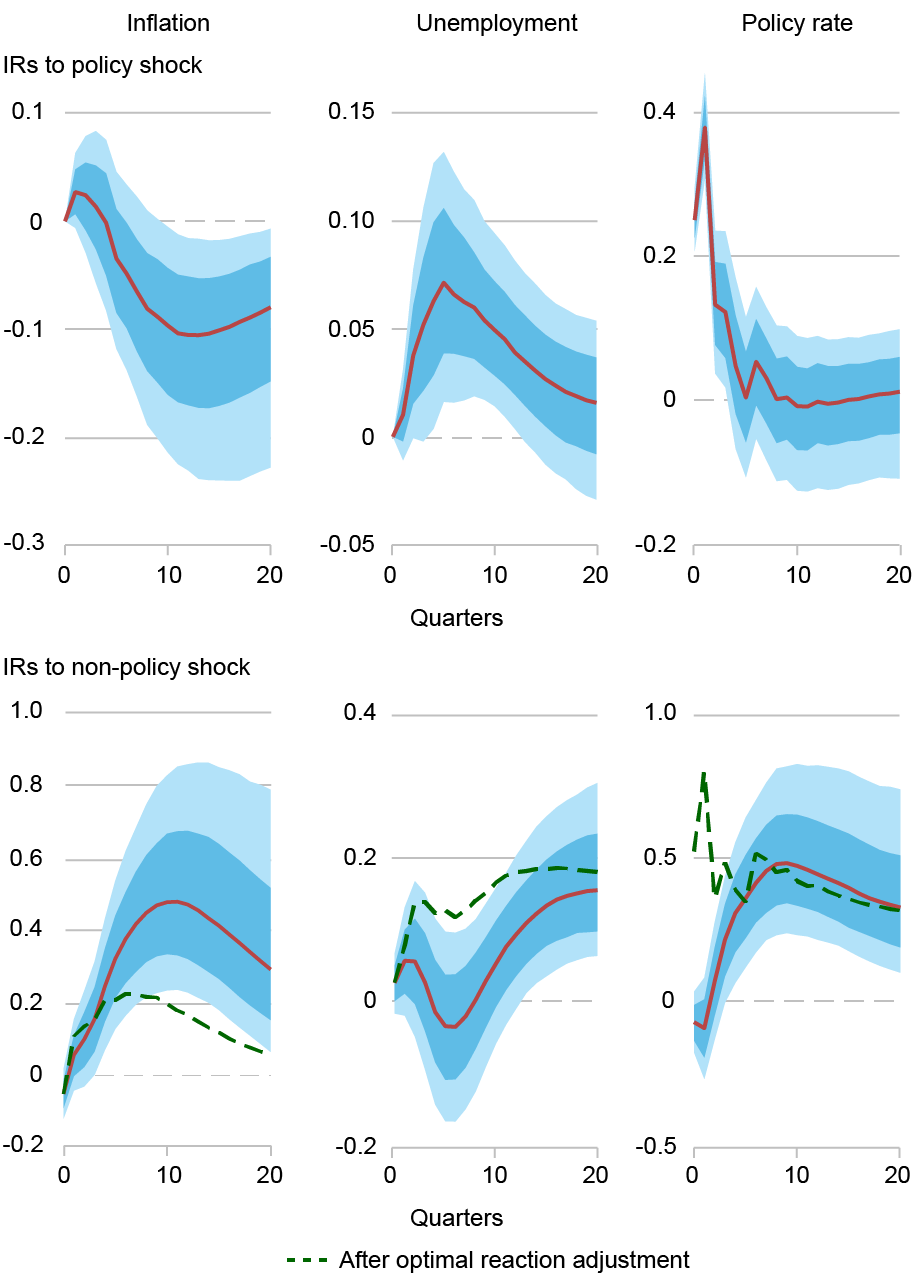
Notes: The top (resp. bottom) rows show the median quarterly responses (thick line) of inflation, unemployment and the Fed’s discount rate to a monetary policy shock (resp. financial shock as measured by bank panics). The dotted green lines show the optimally adjusted impulse responses. The 95% and 67% confidence bands.
Wrapping Up
Comparing monetary policy across history requires separating the quality of policy from the economic environment in which it was conducted. Our framework provides a way to make that distinction by comparing actual policy with the best response that was feasible given the shocks policymakers faced.
Applying this framework to 150 years of U.S. monetary history yields broad conclusions. First, meaningful improvements in the conduct of monetary policy occurred surprisingly late in the history of the Federal Reserve. Second, those gains were concentrated in the Federal Reserve’s improved response to financial crises and supply shocks.
*Barnichon, Regis and Mesters, Geert, “Evaluating Policy Institutions–150 Years of US Monetary Policy,” Econometrica, forthcoming

Regis Barnichon is a senior research advisor at the Federal Reserve Bank of San Francisco.

Geert Mesters is an economic research advisor in the Federal Reserve Bank of New York’s Research and Statistics Group.
How to cite this post:
Regis Barnichon and Geert Mesters, “Has U.S. Monetary Policy Really Improved? A 150‑Year Perspective,” Federal Reserve Bank of New York Liberty Street Economics, November 9, 2026, https://doi.org/10.59576/lse.20261109
BibTeX: View |
Disclaimer
The views expressed in this post are those of the author(s) and do not necessarily reflect the position of the Federal Reserve Bank of New York or the Federal Reserve System. Any errors or omissions are the responsibility of the author(s).
 You can follow this conversation by subscribing to the comment feed for this post.
 RSS Feed
 Follow Liberty Street Economics