










Credit card delinquency rose sharply between 2022 and 2024, and the increase was steepest among borrowers in lower-income neighborhoods. Here, we check in on credit card performance by neighborhood income and trace when the borrowers who are now struggling with their payments were issued cards. We find that during the pandemic, an increasing share of new credit cards went to borrowers with lower incomes and credit scores, and those accounts are now showing higher levels of distress.
This analysis accompanies the latest Quarterly Report on Household Debt and Credit, by the New York Fed’s Center for Microeconomic Data. The report shows that total nominal household debt balances increased by $334 billion in the third quarter of 2026, a 1.8 percent increase from the second quarter of 2026. Although delinquency rates for mortgages worsened slightly, transition rates into serious delinquency were largely unchanged across non-housing debt types.
Note: The Quarterly Report and this analysis are based on the New York Fed Consumer Credit Panel, which is drawn from anonymized Equifax credit reports.
A Widening Gap by Neighborhood Income
We begin our analysis by showing trends in the rate of newly delinquent credit card balances segmented by quartiles of average zip code income. These delinquency rates declined for all groups and converged during the pandemic, when forbearances, stimulus payments, and reduced consumption led to improved payment behavior. Since 2022, however, this measure of household distress worsened. Recent delinquency rates are higher than pre-pandemic levels for all groups, and the gap between borrowers living in higher-income neighborhoods and lower-income neighborhoods has expanded.
The Credit Card Delinquency Gap Between Low-Income and High-Income Areas Widened After 2022
Flow into serious delinquency
Notes: Zip income quartile (1 = lowest). The flow into serious delinquency is defined as the percent of balance not 90+ days past due in the previous quarter that became 90+ days past due in the current quarter, shown as a four-quarter moving sum. Borrowers are divided into four quartiles of equal population by the mean adjusted gross income in their zip code.
As previously noted, this surge partially represents a reversal of pandemic-era dynamics: federal economic stimulus compressed delinquency rates during the pandemic, but today, most households have exhausted their pandemic-era savings and most fiscal and monetary supports have ended. In addition, macroeconomic headwinds —namely high inflation and rising borrowing costs —have squeezed consumers, with inflation outpacing wage growth for low-income brackets.
Loosening Credit Standards During the Pandemic
Although macroeconomic conditions were likely the main contributing factor to the reduction and subsequent increase in delinquency rates, we also explore whether the pandemic-era loosening in credit supply played a role. During the pandemic, deferments, forbearances, and loan modifications contributed to increasing credit scores because many borrowers who would have otherwise been reported past due avoided delinquency. Concurrently, strong consumer demand combined with low interest rates may have prompted some lenders to ease underwriting standards and extend credit to those previously not served.
In the chart below, we plot the share of new credit cards (blue) and new credit limits (red) in each quarter extended to borrowers in the lowest quartile of neighborhood income (the same group comprising the blue line in the first chart). At the start of the pandemic, the share of new cards and credit limits going to these borrowers each rose by nearly 2 percentage points, and the shares remained elevated until 2023, consistent with lenders easing underwriting standards during that period.
More Cards and Credit Were Issued to Borrowers in Lower-Income Areas Between 2020-22
Share Extended to Borrowers in the Lowest Zip Income Quartile
Percent of new originations
Notes: The flow into serious delinquency is defined as the percent of balance not 90+ days past due in the previous quarter that became 90+ days past due in the current quarter, shown as a four-quarter moving sum. Borrowers are divided into four quartiles of equal population by the mean adjusted gross income in their zip code.
Evidence from credit scores further confirms this easing. The chart below shows that the median credit score at card issuance fell from an average of 699 in 2017–19 (green region) to 688 during the 2020–22 period (red region). Notably, the decline in median credit score at origination likely understates the extent of easing since credit scores in the population were generally increasing during the same time, as shown in the blue line. However, this trend reverted toward the end of 2022, similar to the trend in card issuance to low-income areas, with median credit scores for new cards for more recent vintages surpassing the pre-pandemic (green) era.
Pandemic-Era Credit Card Originations Had Lower Credit Scores
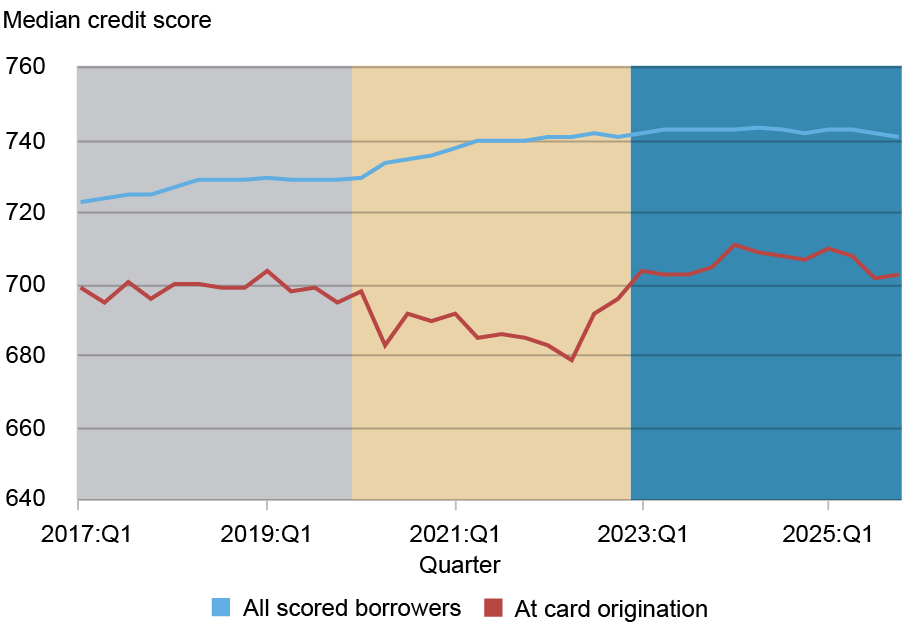
Note: Credit score is Equifax Risk Score 3.0.
Next, we explore how each of these vintages performed given their varied credit quality at issuance. The chart below decomposes our serious delinquency transition rate, the share of balances that became newly 90 or more days delinquent, by the same three vintages in the chart above along with the cards issued prior to 2017. Here we see a similar pattern across most vintages. Most new delinquencies in each quarter come from more recent vintages, as newly opened “unseasoned” debts have historically been the most likely to fall past due. The cards issued prior to 2017 had already reached their peak delinquency rate by 2018 and were waning in their contribution to the whole throughout the series.
Meanwhile, the 2017-19 vintage reached its relatively low peak during the pandemic era where forbearances and fiscal and monetary supports helped produce historical lows in delinquency. On the other hand, the 2020-22 vintage showed a rapid rise and high peak throughout 2023 and into 2024 where it made up a sizable share of new delinquencies across all vintages, perhaps due to the relatively lower credit quality of this vintage. Notably, cards issued since early 2023 have generally gone to borrowers with higher scores.
The Effect of the Pandemic-Era Vintage is Waning
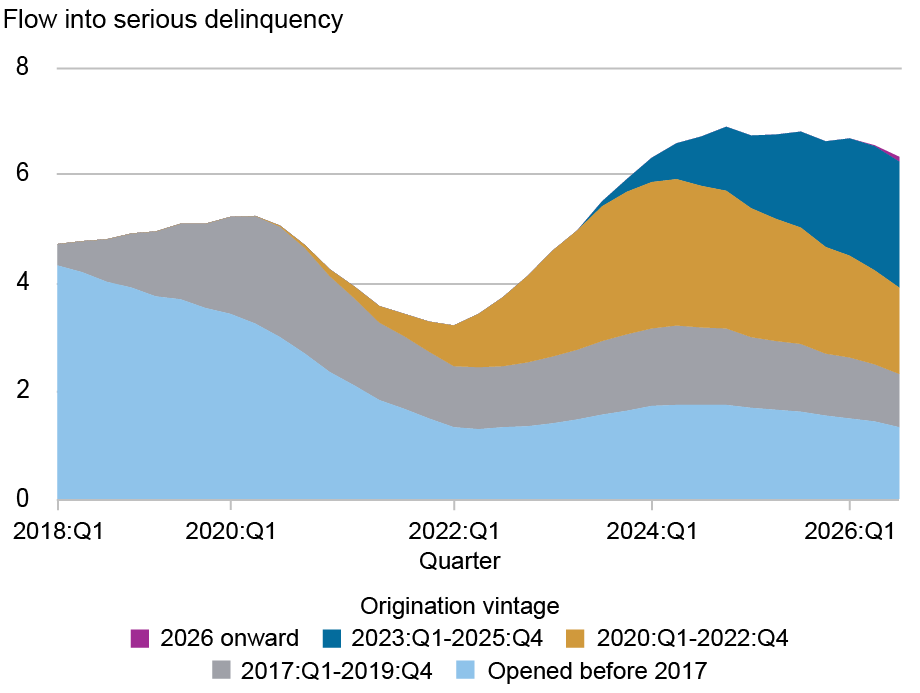
Source: New York Fed Consumer Credit Panel/Equifax.
What Does This Mean for Delinquency Rates Moving Forward?
Delinquency rates for cards issued during the pandemic are abating. If current patterns hold, the elevated delinquencies of the past few years may prove to be more of a pandemic-era echo than a permanent feature of the credit card market—one that may continue to fade as 2020-22 vintages make up a shrinking (and positively selected) share of “surviving” cards.
Of course, since newer cards are more likely to fall past due, the largest factor for near-term delinquency rates is the credit quality of the most recently issued cards. Thus far through 2025, the credit quality of new issuances, as captured by origination credit scores, is below that of 2024 but above the levels of the pre-pandemic and pandemic eras. So, absent macroeconomic shocks, we anticipate that new credit card delinquencies will likely continue to see signs of improvement, and we will continue to monitor the trends in card performance in the coming quarters.

Donghoon Lee is an economic research advisor in the Federal Reserve Bank of New York’s Research and Statistics Group.

Daniel Mangrum is a research economist in the Federal Reserve Bank of New York’s Research and Statistics Group.

Joelle W. Scally is an economic policy advisor in the Federal Reserve Bank of New York’s Research and Statistics Group.

Tejas Sinha is a research analyst in the Federal Reserve Bank of New York’s Research and Statistics Group.

Wilbert van der Klaauw is an economic research advisor in the Federal Reserve Bank of New York’s Research and Statistics Group.
How to cite this post:
Donghoon Lee, Daniel Mangrum, Joelle W. Scally, Tejas Sinha, and Wilbert van der Klaauw, “A Look at the Wider Divide in Credit Card Delinquency by Income,” Federal Reserve Bank of New York Liberty Street Economics, November 10, 2026, https://doi.org/10.59576/lse.20261110
BibTeX: View |


Disclaimer
The views expressed in this post are those of the author(s) and do not necessarily reflect the position of the Federal Reserve Bank of New York or the Federal Reserve System. Any errors or omissions are the responsibility of the author(s).
 You can follow this conversation by subscribing to the comment feed for this post.
 RSS Feed
 Follow Liberty Street Economics