










The start of the Middle East conflict in early 2026 caused an unprecedented drop in global petroleum supply. In response, oil prices jumped—but not to unprecedentedly high levels. The U.S. oil sector was a key factor in moderating the shock. For one, its steady increases in drilling helped create a large oversupply in the global market before the conflict, making it less of a challenge to offset the drop in Middle East oil output. In addition, U.S. commercial and government inventories were rapidly drawn down, filling half the gap between global supply and demand in the second quarter by some estimates. Inventories, though, are a limited resource and U.S. stockpiles stopped falling in July. As a consequence, the continued shortfall in global production has been managed by running down inventories in the rest of the world.
The Transformation of the U.S. Oil Sector
The U.S. economy has a history of being vulnerable to geopolitical developments. Domestic drilling stopped rising in 1970, meaning that increases in consumption had to be satisfied by imports, which doubled from 1970 to 1973. Most of this new supply was from OPEC and the 1973 crisis illustrated how domestic gasoline prices could rise dramatically because of foreign developments. This point was reinforced by another price shock in 1979.
This vulnerability led to the creation of the Strategic Petroleum Reserve (SPR), a government stockpile to be released when oil supplies were threatened, but little else could be done about the underlying trend. In the years that followed, the rise in oil demand, coupled with stagnant drilling, caused imports to exceed exports by 9 million barrels per day (mb/d) in 2010, or almost half of domestic consumption.
The situation changed with the adoption of fracking technology. As seen in the chart below, U.S. output of crude oil and other liquid fuels jumped from 8 mb/d in 2010 to 21 mb/d in 2025. To put the increase in perspective, global production rose by 19 mb/d over this period, meaning the United States accounted for 70 percent of that gain.
U.S. Production Has Increased Dramatically
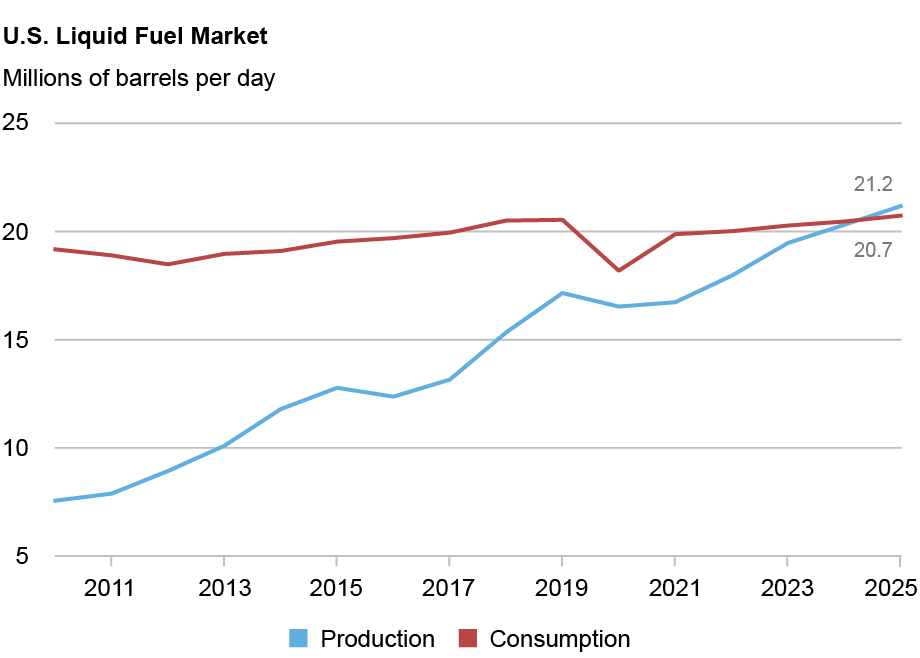
A key development behind the sustained production surge was the 2015 repeal of a 1975 law that had largely prohibited exports of crude oil. (Exports of refined products were not restricted.) The industry successfully argued that the potential output from the Permian Basin in New Mexico and Texas was more than the Gulf region’s refineries could accommodate. Its recommended solution to this bottleneck was to permit selling into foreign markets. Consumers would benefit, even if the added oil was exported, as the boost to global production would feed back into lower domestic prices.
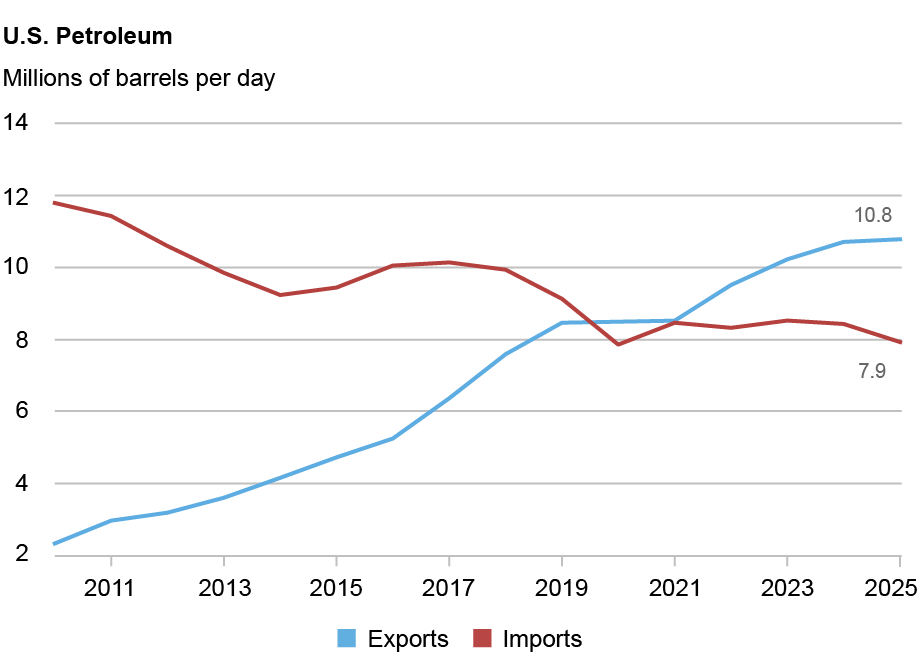
The chart below shows how the 2015 repeal affected trade flows. From 2010 to 2015, the increase in drilling reduced imports of crude liquids and refined products and increased exports by roughly equal amounts (2 mb/d). But with the end of restrictions on crude oil sales, petroleum exports increased by an additional 6 mb/d from 2015 to 2025, while imports fell by 2 mb/d.
U.S. Petroleum Exports Now Exceed Imports
A Sudden Shortage After Being Oversupplied
The conflict with Iran severely disrupted the petroleum market. The chart below shows the U.S. Energy Information Administration’s (EIA) estimate of global production of liquid fuels and global consumption. The change in inventory levels is the gap between the production (supply) and consumption (demand) lines based on the market clearing equation:
Supply + Change in Inventories = Demand
For example, the last observation for September puts production at 101 mb/d and demand at 104 mb/d, implying inventory levels declined at a rate of 3 mb/d in the month.
Inventories Were Growing Before Hostilities Started

Supply moved substantially above demand over the course of 2025, as higher output in the United States, Brazil, and others increased production while demand rose more slowly. Consequently, inventories went from being unchanged in 2024 to rising at a 2 mb/d average rate in 2025 and at a 4 mb/d rate in the first two months of 2026. Global production collapsed by 12 mb/d in March, so having this oversupply significantly reduced the amount of the shortfall that had to be made up.
The gap between supply and demand caused inventories to fall at a rate of 5 mb/d in March. Similar drawdowns happened in April and May before output recovered in June when tensions eased, leaving inventories shrinking at a 3.5 mb/d rate in the second quarter. Inventories stabilized in July, but the resumption of tensions caused inventory levels to fall at a 3 mb/d rate in August and September.
Running Down the Buffer
How did the U.S. oil sector help bridge the supply shortfall? The options were either to increase production or to draw down inventories. There was not much that could be done immediately on the production side as the industry does not operate with spare capacity. Drilling is growing but at a rate similar to rates achieved in recent years, with the EIA forecasting U.S output rising by 0.7 mb/d in 2026 versus 0.9 mb/d in 2024 and 2025.
That left domestic inventories. Their level was unchanged in March but then fell in the next three months, with the SPR releasing crude oil at the rate of 1 mb/d in the second quarter and commercial inventories falling at a 0.7 mb/d rate. Together this drawdown accounted for roughly half of the estimated drop in global inventory levels.
The decline in inventories, along with modest changes in drilling and consumption, translated into more oil available for the rest of the world. In terms of trade flows, net exports increased by 2.5 mb/d in the second quarter, with exports up 2 mb/d and imports down by 0.5 mb/d.
U.S. inventories stopped falling in July, as seen in the chart below, and remained relatively flat through September. The end of the drawdown caused the net exports balance in the third quarter to fall back to near its first quarter level.
Inventory Levels Stopped Falling in July
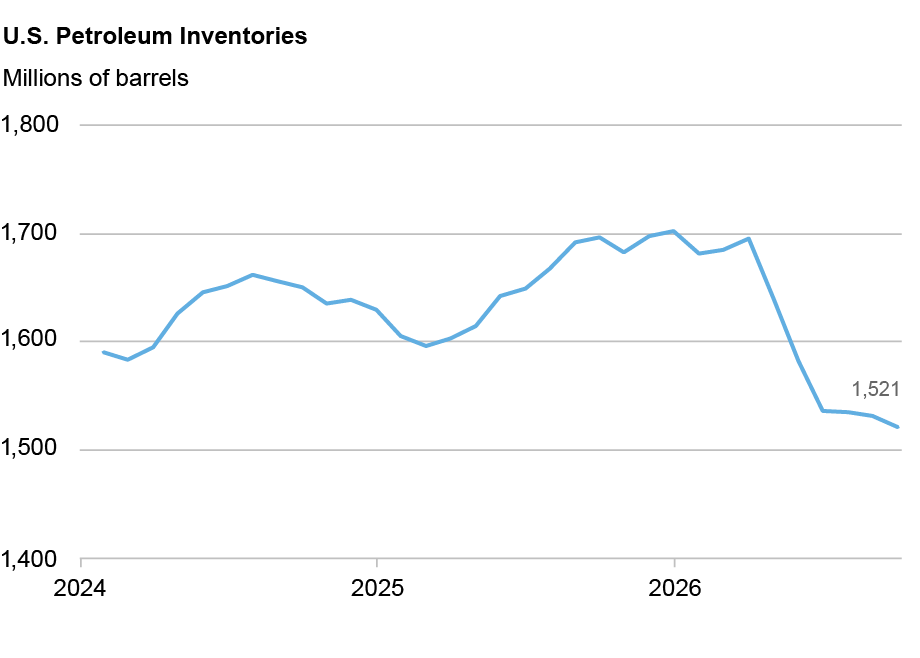
The implication is that the ongoing depletion of global inventories is being left to other countries. Most notably, China, the world’s second largest consumer of petroleum, has made severe cuts to its imports since April, suggesting a substantial rate at which its oil stocks have been run down.
Looking Forward
It is not clear how the Middle East conflict will be resolved. Consider two outcomes. In one, the conflict ends and output from the Middle East countries returns to pre-conflict levels. Prices then face downward pressure as the market heads back to being oversupplied, with the caveat that prices may not quickly return to pre-conflict levels as the world rebuilds its stockpiles. Another possibility is that Middle East output remains significantly below its previous level causing the gap between global supply and demand to persist. At some point, global inventory levels get too low and demand must fall to match supply.
The U.S. oil sector is doing its part to moderate price pressures by boosting domestic oil output. On the demand side, progress in electrifying transportation is lowering global oil consumption from what it would be otherwise. Indeed, one result of the turmoil is that it encourages faster electrification, bringing forward the year when global oil demand starts to decline.

Thomas Klitgaard is an economic policy advisor in the Federal Reserve Bank of New York’s Research and Statistics Group.
How to cite this post:
Thomas Klitgaard, “The U.S. Oil Sector’s Role in Restraining Prices,” Federal Reserve Bank of New York Liberty Street Economics, November 5, 2026, https://doi.org/10.59576/lse.20261105
BibTeX: View |



Disclaimer
The views expressed in this post are those of the author(s) and do not necessarily reflect the position of the Federal Reserve Bank of New York or the Federal Reserve System. Any errors or omissions are the responsibility of the author(s).
 You can follow this conversation by subscribing to the comment feed for this post.
 RSS Feed
 Follow Liberty Street Economics