Dropping Like a Stone: ON RRP Take‑up in the Second Half of 2023

Take-up at the Overnight Reverse Repo Facility (ON RRP) has halved over the past six months, declining by more than $1 trillion since June 2023. This steady decrease follows a rapid increase from close to zero in early 2021 to $2.2 trillion in December 2022, and a period of relatively stable balances during the first half of 2023. In this post, we interpret the recent drop in ON RRP take-up through the lens of the channels that we identify in our recent Staff Report as driving its initial increase.
Hey, Economist! Outgoing Advisor Antoine Martin Reflects on How His New York Fed Perch Has Shaped His Work

Antoine Martin, an economist and financial stability advisor in the New York Fed’s Research and Statistics Group, will soon take up a new post at the Swiss National Bank (SNB), as head of its third department covering money markets/foreign exchange (FX). In that role, Martin, who is originally from Switzerland, also becomes one of three members of that central bank’s rate-setting governing board. Readers of Liberty Street Economics will be familiar with his byline, as he has written more than sixty posts presenting new research findings and policy analysis, all with an eye for breaking down the most complicated topics in clear terms. He took a few questions from publications editor Anna Snider about his experiences and future plans as he prepares to move on.
FHA First‑Time Buyer Homeownership Sustainability: An Update

An important part of the mission of the Federal Housing Administration (FHA) is to provide affordable mortgages that both promote the transition from renting to owning and create “sustainable” homeownership. The FHA has never defined what it means by sustainability. However, we developed a scorecard in 2018 that tracks the long-term outcomes of FHA first-time buyers (FTBs) and update it again in this post. The data show that from 2011 to 2016 roughly
21.8 percent of FHA FTBs failed to sustain their homeownership.
A Bayesian VAR Model Perspective on the Lagged Effect of Monetary Policy

Over the last few years, the U.S. economy has experienced unusually high inflation and an unprecedented pace of monetary policy tightening. While inflation has fallen recently, it remains above target, and the economy continues to expand at a robust pace. Does the resilience of the U.S. economy imply that monetary policy has been ineffectual? Or does it reflect that policy acts with “long and variable lags” and so we haven’t yet observed the full effect of the monetary tightening that has already taken place? Using a Bayesian vector autoregressive (BVAR) model, we show that economic activity has, indeed, been substantially stronger than would have been anticipated considering the rapid policy tightening. Still, the model expects a significant slowdown in 2024-25, even though short-term interest rates are forecasted to fall.
Small Business Recovery after Natural Disasters in the Fed’s Second District
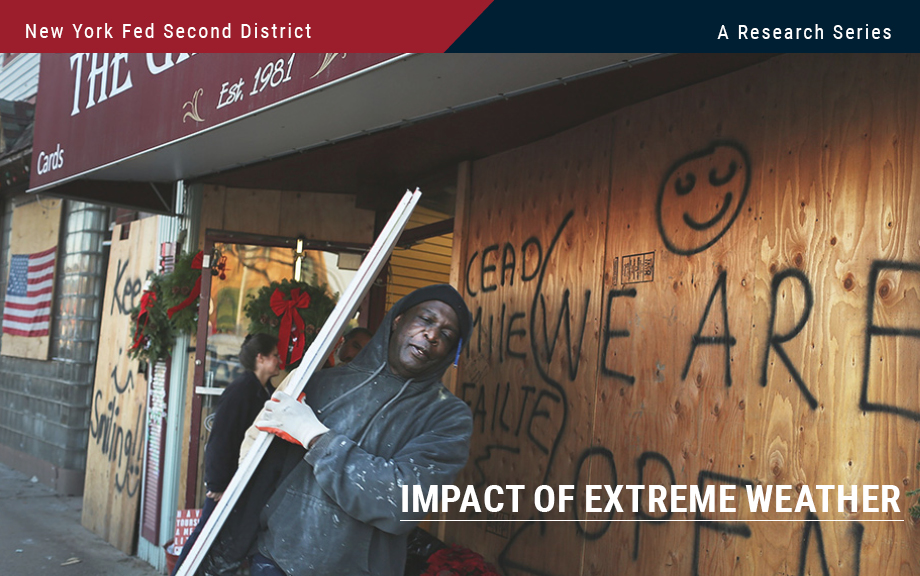
A previous Liberty Street Economics post found that minority-owned small businesses in the Federal Reserve’s Second District have been particularly vulnerable to natural disasters. Here we focus on the aftermath of disasters (such as hurricanes, floods, wildfires, droughts, and winter storms) and examine disparities in the ability of these firms to reopen their businesses and access disaster relief. Our results indicate that while white- and minority-owned firms remain closed for similar durations, the latter are more reliant on external funding from government and private sources to cope with disaster losses.
How Do Natural Disasters Affect Small Business Owners in the Fed’s Second District?
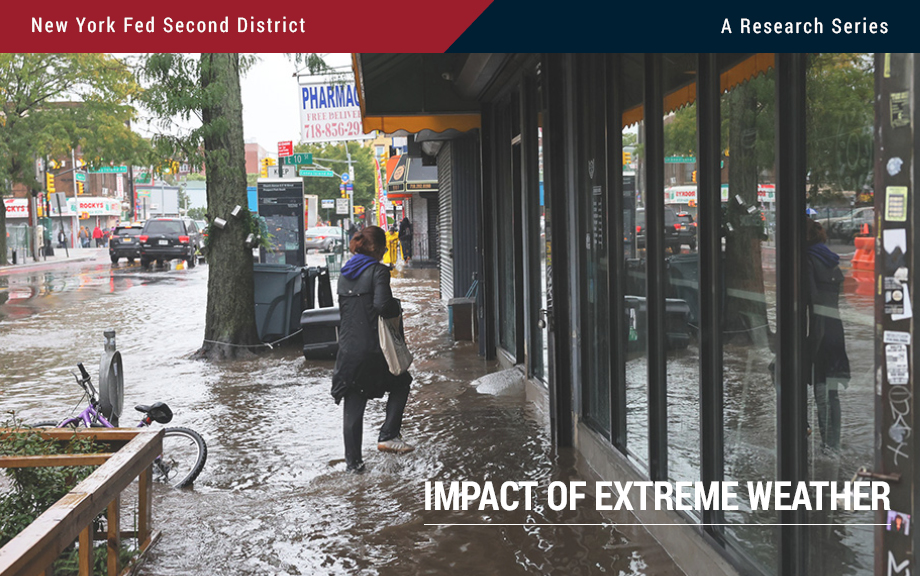
In this post, we follow up on the previous Liberty Street Economics post in this series by studying other impacts of extreme weather on the real sector. Data from the Federal Reserve’s Small Business Credit Survey (SBCS) shed light on how small businesses in the Second District are impacted by natural disasters (such as hurricanes, floods, wildfires, droughts, and winter storms). Among our findings are that increasing shares of small business firms in the region sustain losses from natural disasters, with minority-owned firms suffering losses at a disproportionately higher rate than white-owned firms. For many minority-owned firms, these losses make up a larger portion of their total revenues. In a companion post, we will explore the post-disaster recovery of small firms in the Second District: how long do they remain closed and what are their sources of disaster relief?
Flood Risk and Firm Location Decisions in the Fed’s Second District
The intensity, duration, and frequency of flooding have increased over the past few decades. According to the Federal Emergency Management Agency (FEMA), 99 percent of U.S. counties have been impacted by a flooding event since 1999. As the frequency of flood events continues to increase, the number of people, buildings, and agriculture exposed to flood risk is only likely to grow. As a previous post points out, measuring the geographical accuracy of such risk is important and may impact bank lending. In this post, we focus on the distribution of flood risk within the Federal Reserve’s Second District and examine its effect on establishment location decisions over the last two decades.
Potential Flood Map Inaccuracies in the Fed’s Second District
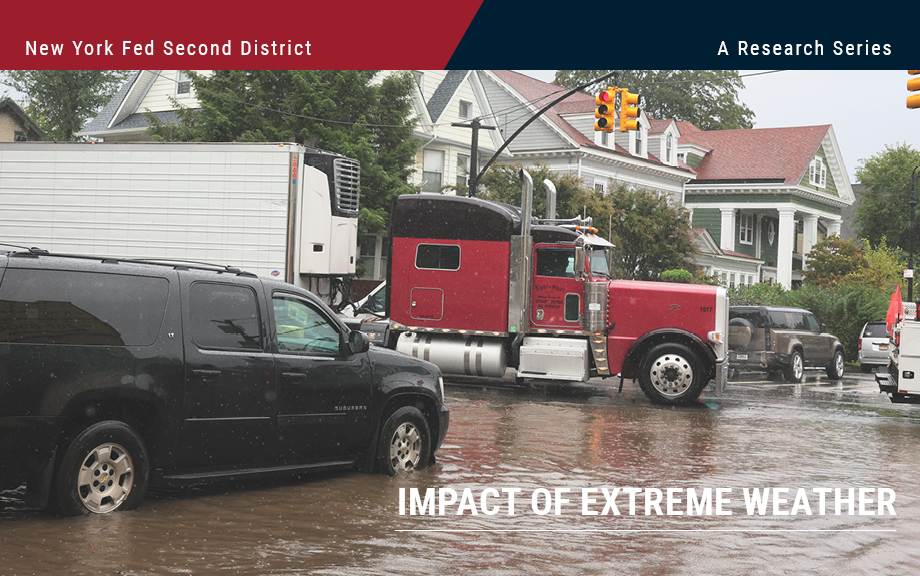
The National Flood Insurance Program (NFIP) flood maps, which designate areas at risk of flooding, are updated periodically through the Federal Emergency Management Agency (FEMA) and community efforts. Even so, many maps are several years old. As the previous two posts in the Extreme Weather series show, climate-related risks vary geographically. It is therefore important to produce accurate maps of such risks, like flooding. In this post we use detailed data on the flood risk faced by individual dwellings as well as digitized FEMA flood maps to tease out the degree to which flood maps in the Second District are inaccurate. Since inaccurate maps may leave households or banks exposed to the risk of uninsured flood damage, understanding map inaccuracies is key. We show that, when aggregated to the census tract level, a large number of maps do not fully capture flood risk. However, we are also able to show that updates do in fact improve map quality.
Transition Risks in the Fed’s Second District and the Nation
Climate change may pose two types of risk to the economy—from policies and consumer preferences as the energy system transitions to a lower dependence on carbon (in other words, transition risks) or from damages stemming from the direct impacts of climate change (physical risks). In this post, we follow up on our previous post that studied the exposure of the Federal Reserve’s Second District to physical risks by considering how transition risks affect different parts of the District and how they differentially affect the District relative to the nation. We find that, relative to other regions of the U.S., the economy of the Second District has considerably less exposure to fossil fuels. However, the cost of reducing even this relatively low economic dependence on carbon is still likely to be considerable.
Comparing Physical Risk: The Fed’s Second District versus the Nation
In this post, we discuss the climate-related risks faced by the Federal Reserve’s Second District and compare these with risks faced by the nation as a whole. The comparison helps contextualize the risks while framing them in the broader context of a changing climate at the national level. We show that the continental Second District—an area consisting of New York State, the twelve northern-most counties of New Jersey, and Fairfield County in Connecticut—faces fewer and less severe climate-related physical risks than the nation as a whole. However, the areas that comprise the Second District still rank somewhat high in key risks that include “heat stress.” This holds true especially for New York City.


 RSS Feed
 Follow Liberty Street Economics