


222 posts on "Household Finance"
May 14, 2024
Delinquency Is Increasingly in the Cards for Maxed‑Out Borrowers
Editor’s note: Since this post was first published, the aggregate credit card utilization rate cited in the second paragraph has been corrected. (May 14, 12:05pm). The percentage of Gen Z credit card users who are “maxed-out” has been corrected in the text and now matches the table. (May 15, 2024, 4:00 pm)

This morning, the New York Fed’s Center for Microeconomic Data released the Quarterly Report on Household Debt and Credit for the first quarter of 2024. Household debt balances grew by $184 billion over the previous quarter, slightly less than the moderate growth seen in the fourth quarter of 2023. Housing debt balances grew by $206 billion. Auto loans saw a $9 billion increase, continuing their steady growth since the second quarter of 2020, while balances on other non-housing debts fell. Credit card balances fell by $14 billion, which is typical for the first quarter. However, an increasing number of borrowers are behind on credit card payments. In this post, we explore the relationship between credit card delinquency and changes in credit card “utilization rates.”
May 8, 2024
How Are They Now? A Checkup on Homeowners Who Experienced Foreclosure
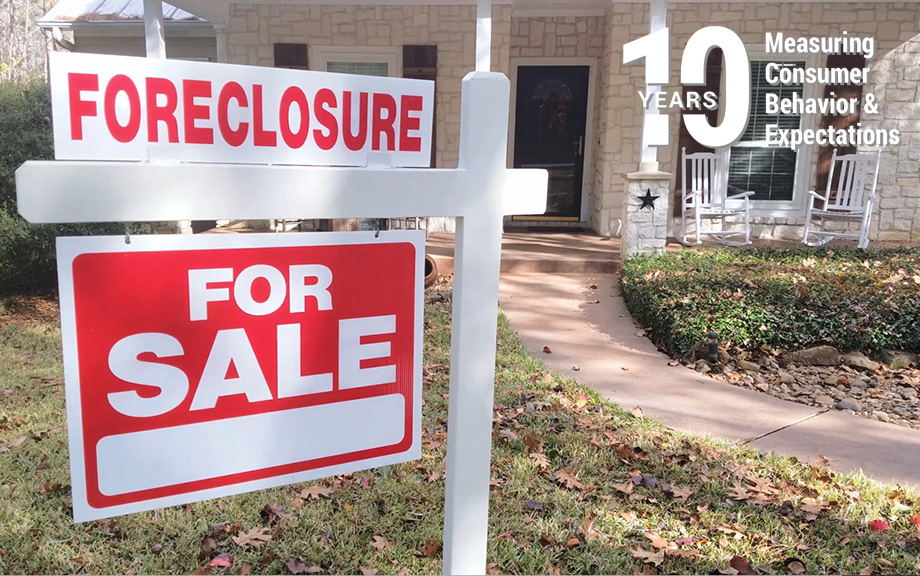
The end of the Great Recession marked the beginning of the longest economic expansion in U.S. history. The Great Recession, with its dramatic housing bust, led to a wave of home foreclosures as overleveraged borrowers found themselves unable to meet their payment obligations. In early 2009, the New York Fed’s Research Group launched the Consumer Credit Panel (CCP), a foundational data set of the Center for Microeconomic Data, to monitor the financial health of Americans as the economy recovered. The CCP, which is based on anonymized credit report data from Equifax, gives us an opportunity to track individuals during the period leading to the foreclosure, observe when a flag is added to their credit report and then—years later—removed. Here, we examine the longer-term impact of a foreclosure on borrowers’ credit scores and borrowing experiences: do they return to borrowing, or shy away from credit use and homeownership after their earlier bad experience?
May 6, 2024
Mortgage Rate Lock‑In and Homeowners’ Moving Plans

The U.S. housing market has had a tumultuous few years. After falling to record lows during the pandemic, the average 30-year mortgage rate rapidly increased in 2022 and 2023 and now hovers near a two-decade high of 7.2 percent. For those that locked in a low mortgage rate prior to 2022, this steep increase has significantly increased the cost of moving, as taking out a mortgage at current rates would potentially increase their monthly housing payment by hundreds or thousands of dollars, even if the amount they borrowed remained unchanged. As shown by Ferreira et al. (2011), this lock-in effect has the potential to reduce geographic mobility and turnover in the housing market and has gained the attention of Federal Reserve leaders. In this post, we utilize special questions from the Federal Reserve Bank of New York’s 2023 and 2024 SCE Housing Surveys to estimate the extent to which mortgage rate lock-in is suppressing U.S. household’s moving plans.
April 17, 2024
The New York Fed Consumer Credit Panel: A Foundational CMD Data Set
As the Great Financial Crisis and associated recession were unfolding in 2009, researchers at the New York Fed joined colleagues at the Board of Governors and Philadelphia Fed to create a new kind of data set. Household liabilities, particularly mortgages, had gone from being a quiet little corner of the financial system to the center of the worst financial crisis and sharpest recession in decades. The new data set was designed to provide fresh insights into this part of the economy, especially the behavior of mortgage borrowers. In the fifteen years since that effort came to fruition, the New York Fed Consumer Credit Panel (CCP) has provided many valuable insights into household behavior and its implications for the macro economy and financial stability.
The CCP was one of the first data sets drawn from credit bureau data, one of the earliest features of the Center for Microeconomic Data (CMD), and the primary source material for some of the CMD’s most important contributions to policy and research. Here we review a few of the main household debt themes over the past fifteen years, and how our analyses contributed to their understanding.
April 1, 2024
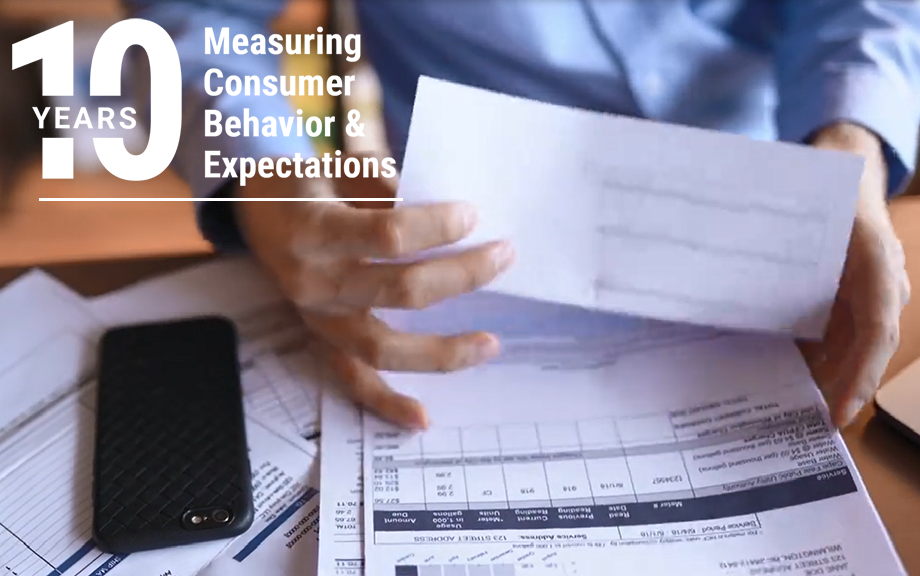
Learning by Bouncing: Overdraft Experience and Salience

Overdraft credit, when banks and credit unions allow customers to spend more than their checking account holds, has many critics. One fundamental concern is whether overdrafts are salient—whether account holders know how often they overdraw and how much it costs them. To shed light on this question, we asked participants in the New York Fed’s Survey of Consumer Expectations about their experience with and knowledge of their banks’ overdraft programs. The large majority knew how often they overdrew their account and by how much. Their overdraft experience, we find, begets knowledge; of respondents who overdrew their account in the previous year, 84 percent knew the fee they were charged, roughly twice the share for other respondents. However, even experienced overdrafters were relatively unaware of other overdraft terms and practices, such as the maximum overdraft allowed or whether their financial institution processed larger transactions first.
February 14, 2024
How and Why Do Consumers Use “Buy Now, Pay Later”?
In a previous post, we highlighted that financially fragile households are disproportionately likely to use “buy now, pay later” (BNPL) payment plans. In this post, we shed further light on BNPL’s place in its users’ household finances, with a particular focus on how use varies by a household’s level of financial fragility. Our results reveal substantially different use patterns, as more-fragile households tend to use the service to make frequent, relatively small, purchases that they might have trouble affording otherwise. In contrast, financially stable households tend to not use BNPL as frequently and are more likely to emphasize that BNPL allows them to avoid paying interest on credit-finance purchases. We explore below what drives these differences and consider the implications for future BNPL use.
February 7, 2024
Wealth Inequality by Age in the Post‑Pandemic Era
Editor’s note: Since this post was first published, percentages cited in the first paragraph have been corrected. (February 7, 1pm)
Following our post on racial and ethnic wealth gaps, here we turn to the distribution of wealth across age groups, focusing on how the picture has changed since the beginning of the pandemic. As of 2019, individuals under 40 years old held just 4.9 percent of total U.S. wealth despite comprising 37 percent of the adult population. Conversely, individuals over age 54 made up a similar share of the population and held 71.6 percent of total wealth. Since 2019, we find a slight narrowing of these wealth disparities across age groups, likely driven by expanded ownership of financial assets among younger Americans.
February 6, 2024
Auto Loan Delinquency Revs Up as Car Prices Stress Budgets

The New York Fed’s Center for Microeconomic Data released the Quarterly Report on Household Debt and Credit for the fourth quarter of 2023 this morning. Household debt balances grew by $212 billion over the last quarter. Although there was growth across most loan types, it was moderate compared to the fourth-quarter changes seen in the past few years. Mortgage balances grew by $112 billion and home equity line of credit (HELOC) balances saw an $11 billion bump as borrowers tapped home equity in lieu of refinancing first mortgages. Credit card balances, which typically see substantial increases in the fourth quarter coinciding with holiday spending, grew by $50 billion, and are now 14.5 percent higher than in the fourth quarter of 2022. Auto loan balances saw a $12 billion increase from the previous quarter, continuing the steady growth that has been in place since 2011. In this post, we revisit our analysis on credit cards and examine which groups are struggling with their auto loan payments. The Quarterly Report and this analysis are based on the New York Fed Consumer Credit Panel (CCP), a panel which is drawn from Equifax credit reports.
December 21, 2023
Where Is R‑Star and the End of the Refi Boom: The Top 5 Posts of 2023
The topics covered on Liberty Street Economics in 2023 hit many themes, reflecting the range of research interests of the more than sixty staff economists at the New York Fed and their coauthors. We published 122 posts this year, exploring important subjects such as equitable growth and the economic impacts of extreme weather, alongside our deep and long-standing coverage of topics like inflation, banking system vulnerability, international economics, and monetary policy effects. As we close out the year, we’re taking a look back at the top five posts. See you again in 2024.
November 30, 2023
FHA First‑Time Buyer Homeownership Sustainability: An Update

An important part of the mission of the Federal Housing Administration (FHA) is to provide affordable mortgages that both promote the transition from renting to owning and create “sustainable” homeownership. The FHA has never defined what it means by sustainability. However, we developed a scorecard in 2018 that tracks the long-term outcomes of FHA first-time buyers (FTBs) and update it again in this post. The data show that from 2011 to 2016 roughly
21.8 percent of FHA FTBs failed to sustain their homeownership.
 RSS Feed
 Follow Liberty Street Economics